Hutto Week 3

Chapter 3 introduces us to the basic of ArcGIS Online Experience Builder which included creating various  widgets such  as a 2D map widget, 3D map widget and a table view widget. All of these were able to put into one centralize page using the experience builder and specifically with the 2D and 3D map widgets, we were able to allow the two to interact with each other if one was for instance zoomed in, the other would zoom in. Chapter 3 also introduced us to pages and ho to create and navigate between multiple pages, for instance, we had a page that showed the data summary  view for hurricanes and earthquakes as well as outside websites which we linked the FEMA website.

Chapter 4 introduces us to mobile integration of ArcGIS online which first included creating surveys with Survey123. Through the creation of a survey through Survey123, we were about to log a particular location on a map embedded within the survey through the Survey123 app downloaded on a phone and see that data in the analyze tab on Survey123 web. We were also able to do something similar using ArcGIS QuickCapture. Using QuickCaputure, we was able to create and equip buttons to be able to allow a perosn to capture photos from the QuickCapture app on a phone which would then also be uploaded to ArcGIS online to see the location of where the photo was taken and for what purpose which depended on which button you clicked within the app. I see this best being used to capture data on  a variety of things which could includes plumbers capturing data on plumbing issues within buildings across a town or city and its location and being able to later go back and look at that data.
Hutto Week 2

Chapter 1 walks us through the basic concepts and important terms to know for ArcGIS Online which includes the history of the development of GIS in the 1960s by Roger Tomlison and later evolved into a web version in the 2000s for better accessibility. The beginning of this chapter discusses  the different ways in which WebGIS is used and is growing in different organizations including government, business, and even personal daily life. Tutorial 1introduced us to the basics of how to create attatchment such as adding a photo, as well as how to create a web map and add symbols and change symbol styles, and configure popups for such symbols.

Chapter 2 begun by walking us through how to create feature layers which included us using data from the 2019 and 2020 census data and using arrows to represent the populations in cities across the United States have either grown or decreased. We also created popups to show the growth and median household incomes of those same cities and learned how to add images and charts to those popups. In Chapter 2, we also learned how to create stories using ArcGIS StoryMaps to show all of the maps that we’ve made. Using ArcGIS StoryMaps, we were able to create map actions which provide a more interactive experience with looking at cities of our choosing.

Hutto Week 1

*I have finished the Quiz and completed the assignments for Week 1*

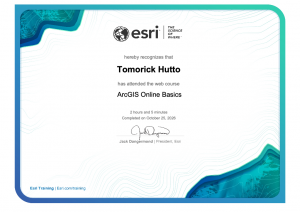
My name is Tomorick Hutto, and I am a Junior majoring in Politics and Government. I previously took Geog 291 as a way of gaining technical skills of GIS for future internships and opportunities related to urban planning, and I am taking this course as a continuation of learning ArcGIS but for Web. As for the first week’s assignment, I was able to get a general feel for ArcGIS Web as well as the various courses that ESRI offers through their website. After taking the ArcGIS Online basic course, not only do I have a certificate proving that I have completed the course but I am also knowledgable of what web maps, web apps, 3D web scenes, and notebooks in ArcGIS Online are and how each of these can be shared with the public, organizational members, or with groups.