Frary Week 6: Final

First web app: Visualizing Migratory Bird Routes

This app is a web map that contains the data and paths of 5 bird species: the herring gull, snowy owl, bald eagle, Sabine’s gull, and turkey vulture. It includes pop-ups when each route is clicked on to give a photo of the bird along with tracking data from the original collection source.

Link: Migratory Bird Data of 5 Species

Second web app: Creating a Garden

This web app depicts a garden design including a flower bed, a 4-way divided vegetable garden, a fountain, and a wooden arbor. At first it was just going to be a web scene, but in order to add sketch layers I had to change it to a web app.

Link: Garden Blueprint

Frary Week 5

Chapter 7

This chapter was all about 3D web scenes! Following the theme of previous chapters, it started out explaining the basic terminology of web scenes. I learned that web scenes are just another name for a 3D web map, which we already have plenty of experience with in this class. Web scenes are especially useful for better visualization of many different applications. The textbook mentions that web scenes can be good for urban planning, architectural designs, and even filmmaking. The latter was an application that I hadn’t previously thought of using Web GIS for…but what I’ve learned taking this course is that this type of software can be used for pretty much anything! Similar to web maps, scenes are also capable of having multiple layers. These layers can have completely different visual styles, like photorealistic layers or cartographic layers. For designing urban planning or architecture, I can see the photorealistic effect coming in handy. This is what I’m envisioning for my second web app design for this course. Later in the chapter, before the tutorials, there are general step-by-step guidelines to get you started on creating a web scene. I found this especially useful and will also be revisiting this when I need help designing my scene. VR (virtual reality) and AR (augmented reality) also find a place in this chapter. The differences between the two are described along with some visual examples. I’ve seen some pretty cool applications for VR, specifically for video games where completely new worlds are constructed. Crazy cool technology!

Future applications

Before I even finished the chapter, I decided I wanted my second web app to be a web scene displaying some form of nature conservancy/park/garden design. In order to accomplish this, I plan on following one of the tutorials supplied at the end of the chapter (likely the park design one). Included in this design will be a native species layout with pop-ups giving some basic information about the species. The exactness of the layout will depend on what public data/symbols I can use for the feature layers. 

Frary Week 4

Chapter 5

In this chapter, I learned how Web GIS can be built not only on the public cloud using ArcGIS Online, but also through “on-premises” systems with ArcGIS Enterprise. On-premises means the system is locally hosted. This is especially useful when security or specific functionality is needed. I explored the similarities and differences between ArcGIS Online and ArcGIS Enterprise and found that they share more in common than they differ. I also learned about three main types of web layers (vector tile, raster tile, and map image) and when each type is most appropriate to use compared to feature layers. The tutorial in this chapter teaches how to connect ArcGIS Pro to portals as well as publishing the different web layers previously talked about. This chapter is useful even if I don’t plan on using on-premises Web GIS because most of this applies to online GIS as well!

Chapter 6

Chapter 6 is all about a very interesting concept: real-time GIS! This software is used to deal with and gather data from objects and events that move and change through time. Data can be generated via mobile phones, sensor networks, smart cities, and the IoT. The IoT was a concept I had never heard of before. It stands for the Internet of Things, and is a large sensor network that collects and exchanges data from any physical object that has sensors and network connectivity. Also in this chapter were different types of spatial temporal data. Dynamic data follows something that moves, like an airplane. Discrete data is happening events, like a car incident or an earthquake. Stationary data is collected from something that stands still but has fluctuating values, like wind speed at weather stations or street traffic speed. Change data is the final type discussed in the chapter, and tracks change or growth- like urban sprawl or or land cover changes. I really enjoyed reading about the variety of spatial temporal data that can be collected.

Future Application

Using spatial temporal data from a geodata base, you could make a raster tile layer or a map image layer to display the change in wooded growth outside a conservation area, or really anywhere to track the movements of deforestation. This would be helpful to monitor how widespread deforestation becomes, and how the surrounding landscape changes shape over time.

Frary Week 3

Chapter 3

This chapter focuses on Web AppBuilder for ArcGIS, one of the most user-friendly tools that allows individuals to create interactive web applications without coding. Instead, Web AppBuilder uses a visual, real-time editing interface with many premade widgets. It further explains how users can build apps by selecting a theme, adding a web map, and configuring various widgets that provide functionality such as navigation, data visualization, filtering, and analysis. Through this system, it is the most flexible and configurable of all the other apps. Regarding widgets, the chapter highlights the importance of them and distinguishes between those that require data and those that do not. The tutorial at the end shows you how to create a web app displaying data on hurricanes and earthquakes. Also included were quick mini-tutorials on how to configure various widgets, like data-independent widgets, chart-type widgets, and filter-type widgets. I liked exploring all the different widget options and drawing graphics with different pre-made symbols.

Chapter 4

Similar to the previous chapter, this one focuses on another app- this time Mobile GIS. This chapter explains how necessary it is to have mobile geographic information system functions in a world that is very smartphone-heavy. After an introduction of the main mobile concepts, the chapter discusses three approaches to building mobile apps. I noticed that this organizational approach was similar to chapter 2’s process of making a configurable app in that it was another three-step process. I guess processes come in threes! There are browser-based, native-based (downloadable and installed), and hybrid-based (combination of browser and native) approaches to developing a mobile app. There are a handful of Esri mobile apps and their different purposes are described. The tutorial also relates to these apps, particularly Collector, Survey123, and ArcGIS.

Potential Future Applications

Sticking to last week’s bird theme, I could create a web app to display bird migration tracking data. This is especially important right now, as birds are beginning to migrate north for the breeding season. Using Web AppBuilder from Chapter 3, I could create an interactive web app that displays bird sightings on a 2D or 3D map allowing users to see where different species have been observed. The app could include widgets like filters to sort by bird species, date, or location, and chart tools to show trends in sightings over time. Using chapter 4 concepts, I could make this app compatible in a mobile setting. It would be much more convenient to be able to observe bird activity from your phone when you’re outdoors. This would probably use the location-based services (LBS) and volunteered geographic information (VGI). It might be best to use a hybrid-based approach to build the mobile app for easier access via download or browser. I’d need to look further into it.

Frary Week 2

GTKWGIS Chapter 1

Understandably so, this first chapter gives an introduction to what GIS is. There is a LOT in this chapter. I feel like they should have either divided this information into different chapters or maybe just simplified some of the concepts, as it is almost too much information to take in. Also included with the introduction is an overview of Web GIS and some advantages. Next, the ArcGIS Web GIS platform is specifically introduced. We get some history behind how Web GIS technology has evolved over the years and an explanation of basic content types and user levels in ArcGIS software. Regarding tech evolution, I was surprised to learn about mobile GIS. Even with phones being so powerful, it seems like maps would be difficult to navigate on such a small device. A demonstration follows of how to create Web GIS apps using a Story Map Tour template. It’s very helpful to have templates that are easy to use, and help produce web apps that are just as easy to use. At the very end of the chapter, they present a tutorial on how to create a Web GIS app using ArcGIS Online that focuses on points of interest in the City of Redlands, California.

GTKWGIS Chapter 2

Zeroing in on material, this chapter focuses on ArcGIS configurable apps. I learned that apps labeled as “configurable” mean they are very user friendly and people can create them with no previous development skills. This allows for a bigger and less exclusive community so that anyone can get involved! Using software such as ArcGIS Online, Portal for ArcGIS, Esri Story Maps, and ArcGIS Solutions are mentioned, which are all configurable apps provided by ArcGIS. Before getting into the meat of the aforementioned configurable apps, the chapter provides a three step process (choose, configure, deploy) to illustrate what using a configurable app looks like. From what I can see, it looks like quite a simple process! Each app like ArcGIS Online and Esri Story Maps gets its own section to display its uses and possibilities. Similar to the end of Chapter 1, this chapter ends in a tutorial as well. I wonder if this will be a theme throughout the textbook. This tutorial teaches the reader to create an app showcasing spatial patterns of population growth in the US and then share your conclusions with the public via Story Maps.

Potential Future Applications

I am currently taking ornithology, which includes labs centered  around identifying and logging bird species. Using similar methods from these chapters, and with my data collected, I could put this data into a local/regional map and create an interactive map that allows me to pinpoint where I saw the species and add these locations to a fuller species range for tracking purposes. I could maybe encourage people to do the same either on my own app or ask people to send me their data. I’m sure researchers already use WebGIS for conservation/migration tracking work!

Frary Week 1

Introduction

Hello, my name is Sam Frary. I’m a senior taking this class in my last semester before graduation. I’m a general zoology major that found out about this class from friends. It sounded interesting, as I’ve never quite interacted with anything like it. I have a lot to learn because I have not taken the first module. On campus, you may see me playing women’s lacrosse or working at the Testing Center!

Beginning Tasks

For this first week, I completed the required activities. This included viewing the syllabus and familiarizing myself with the website for this course. This was followed by the syllabus/course quiz. Continuing to follow the directions, the next step was to schedule some future meetings with Prof. Krygier. From my understanding, these meetings can be in person or on zoom- but I will have to confirm that with Krygier.

Getting Familiar with ArcGIS

Before spring break, I made sure both WordPress and ArcGIS accounts were set up and ready to go for the remaining part of the semester. Now it came time to put the accounts to use. Logging into ArcGIS, I made sure my profile was correct and proceeded to explore the site and its different tabs. I was completely unfamiliar with Esri- or really anything involving geographic information systems. I learned that they are the global market leader in GIS software and mapping. On the “Community and Forums” tab, which displayed a combination of posts, questions, and ideas from the GIS community.

Get Started: What Is ArcGIS Online

It seems like you can do a whole lot with ArcGIS Online, including making maps, web apps, and even notebooks. The introduction tabs split up the learning into working with maps, scenes, apps, notebooks, and data.

ESRI Free Course: ArcGIS Online Basics & More

This was a lot of information to take in, but it also wasn’t super complicated to complete because of the step-by-step instructions. I’m excited to continue using this software to make more maps/explore.

If I were to complete more courses in the training section, “Telling Stories with GIS Maps” seems interesting and up my alley!

GIS Application

Eagles and Wind Turbines: Using Maps to Protect Animals and Increase Renewable Energy Use. This uses GIS application in a way that supports conservation of both living things and energy consumption. https://www.tandfonline.com/doi/full/10.1080/19338341.2022.2117725

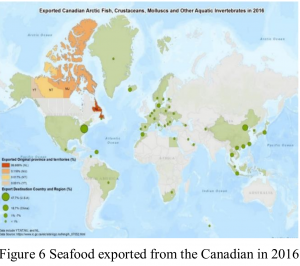
Using GIS and Web GIS to Visualize the Canadian Arctic Food System. This article uses Web GIS to show food systems/information of the Canadian Arctic, such as seafood exportation pathways (shown below). https://ceur-ws.org/Vol-2323/SKI-Canada-2019-7-1-2.pdf