Gist – Week 3

Chapter 3-

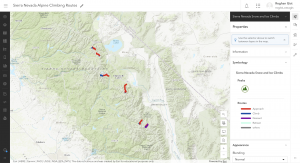
This chapter focuses on the ArcGIS Experience Builder. It teaches users when and how to use it, the terminology behind it, the workflow for creating apps, widgets content and style, triggers and actions, and more. The purpose of the Experience Builder is to let you create unique web experiences with more flexible layouts, content, and widgets that act around 2D and 3D data. This gives you lots of creative freedom if creating an app. To begin, you can choose between a premade template or create your own. This also allows you pick the theme of the app and add in the GIS data. You can also include widgets that change function and style based off what your desired action is. The widgets include basic and layout. Basic is mainly for app tools and include map, legend, query, filter, edit, chart, elevation profile, and more. Layout are created to help organize them onto pages or windows. These can also perform different actions: message and data. It can also be altered to fit any screen size based off what the users will likely access it on. The main thing that stood out to me during this reading was how much more advanced the projects on WebGIS appear to be. They also seem to be more audience focused compared to the desktop GIS application. The reading also explains the editions of experience builder which include developer, ArcGIS Online, and Portal for ArcGIS. The tutorial of this chapter focused on creating a web experience of hurricane and earthquake data.

An idea of a project that I could complete using the Experience Builder is an app focused on traffic in populated areas. The experience would take average commuter time, traffic data, and accident density within the area. The app could also include interactive portions that could have live updates of where accidents are to help users find the most efficient route. This app created through the Experience Builder would be aimed to help people living in cities know how the commute time will change based of time of day, and can help them save time.

Chapter 4-

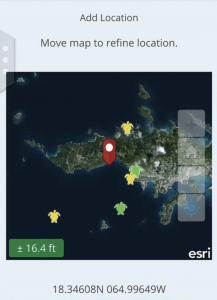
This chapter is all about Mobile GIS. It first explains the advantages that Mobile GIS has over the traditional desktop version. These include mobility (being able to take the device anywhere), location awareness through GPS and cellular data, easy data collection, real-time information, more users, and being overall more versatile. The advantage that has directly impacted me this class has been the mobility. It is much more efficient to do work when I can take my laptop anywhere, rather than having to create a set time to go work in the computer lab. To elaborate off the advantage of more users, a layer is added into Mobile GIS that allows you to alter who can view your project. There are additionally different approaches that come with Mobile GIS. These include browser-based, native-based, and hybrid-based approaches. The browser-based allows users to access through mobile web browsers and can reach all mobile platforms. Native-based requires more developer skills and is an app you download onto your device. While this leads to better performance, they often can not run on all platforms and are more expensive to develop. Finally, a hybrid-based approach uses native components and HTML and JavaScript to build native applications. This loads the data into a native app and lets you have deeper integration onto the platform. The chapter also develops on VGI, VR, and AR and how those work within the software. The most interesting tutorial in this chapter was the one describing how a university wants students, staff, and public to report nonemergency incidents on campus. I found this one interesting because it was very similar to my application idea of last weeks assignment, and was a base of how I could achieve that.

An application idea based off this chapter would be creating a community environmental app. This is similar to an app I used in my Biology class that let us take pictures of native plants and upload them into the app to get a better idea of what plants grow in a local area. My idea to add onto this would be an app that lets people take pictures and add when they plant or create a native garden. This would allow community to see where and how people are doing this, and could promote more people to plant native rather than the typical invasive plants. This specifically uses the advantage of real-time data, mobility, and more users.


Gist-Week 2

Chapter 1 focuses on getting started with WebGIS and introduces the basic concepts and workflows. It explains that this system can integrate data and software to allow users to create and share the geographic information. One thing I found interesting is when it explained historically GIS was limited to desktop and could only be accessed by specialists. Now, WebGIS expanded the access to way more people to use through their own mobile devices. While WebGIS seems more accessible, I found it cool that now ArcGIS pro is used by many more people and students today. It also adds further into what we learned last week and explains how collaborative the web version is. It does this by allowing for data sharing in real time and sharing through your organization. By being more accessible and interactive, this is crucial for projects like environmental response, natural disaster response, and urban planning.

Chapter 2 goes through more of the structure and what makes up WebGIS. The tools they described were web maps, services, layers, and portals. The web maps allow users to both visualize and interact with the spatial data provided. Layers are structured to organize different information including roads and weather. And finally, web services are created to deliver data for people to use without using specialized software. This is very similar to the previous desktop GIS, in the sense of how customizable each step is within the system.

One project that could be done using the information in these chapters is creating an Ohio Wesleyan campus safety map. The layers needed for this would include residential and academic buildings, parking lots, sidewalks or paths, and roads that run through campus. The web services would provide real time updates which could include any alert needed, closures, and could be as simple as marking which sidewalks are dangerous during the winter months. To get more in depth, the web services could dive deeper and include weather updates and alerts, reminding students to bring umbrellas or coats to class if needed. From this chapter, this project focuses on the collaboration portion, of allowing the information to be accessible and updated to all students on campus. It also highlights using real time data through the spatial data that is a big portion of WebGIS.

Gist – Week 1

Hello, my name is Reghan Gist! I am a first year majoring in Environmental Science, and am planning to add Zoology as well. I run both cross country and track here at Ohio Wesleyan. This is my second GIS course, I took the Desktop class earlier this semester.

I completed the quiz, and took Geog 291, so I did not schedule an appointment for weeks 2 and 3. I also already have access to my OWU ArcGIS online account from earlier this semester!

After looking around at my profile once I logged in there were a few notable findings. The first one is that in My Esri you are able to add the organizations you work with and both store payments and purchases. The second thing I found was located in Resources and Support and had training and videos that allow you to sign up for different types of courses that teach you how GIS works. This would be helpful for if you were not learning GIS through a class, and instead were expected to figure it out on your own.

The next activity of this week was reading through Get Started: What Is ArcGIS Online. The first thing I noticed was how it is different from WebGIS. The first difference I noticed was that you can add collaborators and share content with people outside your organization. Another difference that I noticed was that WebGIS allows you to collect data and monitor projects, supporting field activities. Through synchronization you can be offline and still see the latest update to the project which is a very convenient feature!

Next, I completed the ArcGIS Online Basics course. The first comment I have after this course was that the app section was confusing but a really interesting tool. The second comment I have was this is much easier to navigate and use than the desktop version earlier this semester. Pictured below is my certificate of completion alongside my example map that the course had you create.

The final activity of this week was to use both Google and Google Scholar to find two examples of ArcOnline for projects.

1. Mapping Arcadia

https://www.proquest.com/docview/3105916469/abstract/B4E12BF5984E4987PQ/1?accountid=40547&sourcetype=Dissertations%20&%20Theses

This first article explained the benefit that community gardens have on certain communities. They explained how it is important to have clear ways to find suitable sites for the gardens to be grown. This study continues to explain by using public parcels you can find potential community garden sites. This idea is super interesting and could be relevant to many communities looking to improve their local biodiversity.

2. Sea Turtle Tracking App

https://www.esri.com/about/newsroom/arcnews/tourists-become-citizen-scientists-with-sea-turtle-tracking-app

This second example I found on Google and was located through Esri. This example was a researcher who built an app that tracks sea turtles called TURT. This app allows tourists, scuba divers, and snorkelers to upload different photos and information on sea turtle sightings. This allows them to add information including the area, weather, date and time to the sighting. The information is then used by conservationists to analyze trends to observe the lives of multiple sea turtle species. What interested me about this project was how it was aimed for the public to have fun to use, and then can be analyzed by scientists later. I love sea turtles and would be super interested to download the app next time I go on a trip! Included below is the image provided of what the app looks like.