App 1: An app that discusses mountain pine beetles and how they affect the lodgepole pine population in Canada and Colorado.
App 2: A dashboard showing recent storm reports in the U.S.
Geography 292: Geospatial Analysis with Web GIS
Module 2: 10/19/2026 - 12/11/2026, OWU Environment & Sustainability
Chapter 7: A 3D scene can be more intuitive to interpret than a 2D map and allow for wider applicability with urban planning and defense simulation. Some 3D apps offer fly-around and X-ray vision. There are two types of scenes: photorealistic scenes and cartographic scenes. Photorealistic scenes aim to recreate reality using photos for textures and are commonly used for cities. A cartographic scene takes 2D mapping techniques and moves them into 3D to display abstract features such as population density and flight paths. A scene has four elements: surfaces, features, textures, and atmospheric effects. Surfaces are often referred to as a digital elevation model (DEM), digital terrain model (DTM), or digital surface model (DSM), and are continuous measurements. Features can be 2D layers or 3D scenes and are the operational layers of the 3D app. Texture provides exterior or interior covers of 3D features and is often aerial imagery or cartographic symbols. Atmospheric effects include lighting and fog. Scene layers have 3D object scene layers, building scene layers, integrated mesh scene layers, point cloud scene layers, point scene layers, and voxel scene layers. 3D object scene layers are used to visualize 3D objects and are created manually or automatically using procedural rules. Building scene layers allow you to visualize and interact with all aspects of buildings and have an overview, discipline (i.e., architectural and plumbing), category layer (i.e., windows and walls), and filters. Integrated mesh scene layers are constructed from sets of overlapping imagery, such as from drones. Point cloud scene layers display large volumes of symbolized point cloud data, typically from lidar or drone images. Voxel scene layers represent multidimensional spatiotemporal data in a 3D visualization. Atmospheric data and space-time cubes are voxel layers. I had a lot more trouble finding the things it was asking for in the tutorial, as some of the settings have been changed since this textbook was released.
Application: I can use this chapter to create a scene of a construction site and compare different plans to compare the impacts of underground pipes, what trees and other natural resources will need to be removed, and how they will fit in with the surrounding areas in terms of height.
Chapter 5: ArcGIS Online is used for creating layers and web apps for the public, but ArcGIS Enterprise is used for building a private Web GIS. ArcGIS Enterprise is used in situations where there is a need for on-site Web GIS (no internet or government regulations), hybrid Web GIS (keep their own infrastructure), and functions only available with ArcGIS Enterprise due to security. Both ArcGIS Online and ArcGIS Enterprise can create multiple web layer types. A raster tile layer is commonly called a tile layer and delivers maps as image files. They are commonly used as basemaps. Vector tile layers deliver maps as grouped vector files in PBF. Vector data is usually smaller than raster data and can be generated much quicker. Map image layers can be drawn using tiles and are used much less today. They can be used for color-shaded relief and large datasets. Feature services can create feature tiles on demand. Map image layer requests are not reusable and run slowly. Raster and vector tile service requests are precached on the web server and are faster than map image layers. Feature layers are used for editing workflows and changing data. If the data is only used for visualization, use raster or vector tile layers. To use ArcGIS Pro to create web layers, you have to prepare your data using ArcGIS Pro, remove unused layers and complex symbols, and then share the web layer and verify it in your ArcGIS Online or Enterprise portal to confirm it is working correctly. When sharing to ArcGIS Enterprise, you can choose to reference registered data or copy all data.
Chapter 6: Spatiotemporal data moves or changes over time. It is categorized into four groups: moving, discrete, stationary, and change. Discrete data is something that “just happens,” such as crimes and earthquakes. The time value is stored in a single attribute field if it happens in a moment, and stored in two attribute fields if it has a start and end time. IoT is the network of devices embedded with sensors that allow them to collect and exchange data. These devices can be things like airplanes, lights, and security cameras. Enterprise IoT applications include smart cities and environmental quality monitoring. Consumer IoT applications include connected cars and smart homes. Geolocation provides context for the IoT ecosystem to understand values. ArcGIS Velocity and ArcGIS GeoEvent perform continuous data processing and analysis, and send alerts when specific conditions occur. ArcGIS Velocity introduces feed items, real-time analytic items, and big data analytic items. The poll method is where a client periodically polls the server to retrieve new data. The push method pushes data to a web client, which is good for analyzing real-time data. Mission is a real-time situational awareness product that helps coordination among a team. It is good for emergencies and military operations. Mission Manager is the web app where missions are created, and Mission Responder is a mobile app that allows location tracking and geomessaging.
Application: You can create a map comparing air quality and temperature, and then create an app that shows how air quality changes over the course of a year.
Chapter three talks about the Experience Builder app. This app can work with 2D and 3D data, has a lot of pre-made widgets, and is very customizable. To make a web experience, you pick a template and theme, add data, add and customize widgets, and then share it. A web experience has a single theme, and each page has a template. A window can be added to a page, and it only has body content. A widget is a JavaScript or HTML component that executes specific functions. Basic widgets perform as app tools such as map, query, and survey. A layout widget helps organize widgets such as sections, rows, and a sidebar. A widget can perform message or data actions. A message action performs actions automatically when triggered, while data actions require users to click and select an action to perform. A message action has a trigger, a target, and an action. The tutorial for this chapter took me much longer to complete. There were a lot more discrepancies in the textbook versus the actual interface. I had an especially hard time figuring out the triggers, but I eventually did. Besides the setbacks, I had a fun time creating a web experience.
Chapter 4 talks about mobile GIS, how to build mobile apps, and use Survey123. Phones do not need wires and can be used anywhere. Feature layers are read-only on Mobile GIS. To be able to edit them, you have to enable editing on the feature layers. You can make a view layer from a hosted feature layer, which allows you to have specific people able to edit, so the public sees any edits immediately. A feature layer can contain a feature template, which makes editing easier and ensures data integrity. You can have preset symbols, data, and default attribute values, which help make sure that no invalid values are entered. Mobile app development includes a browser-based approach, a native-based approach, and a hybrid-based approach. A browser-based approach uses HTML, Java, and CSS. This costs less but has a limited number of features. A native-based approach requires development skills. They are more expensive, cannot run on multiple platforms, but have deep-level access to the hardware of the device. A hybrid-based approach combines browser-based and native-based. Field maps capture locations. Track viewer allows administrators to manage the security of those locations. Survey123 provides two ways to design forms: Survey123 Web Designer and Survey123 Connect. The web designer is easier to use, but connect supports more advanced questions. LBS provides information or entertainment. VGI is spatial data produced by citizens rather than data producers. VR is a computer-generated simulation of a 3D map that can be interacted with. AR overlays computer-generated information on the live view. I had a lot of trouble with tutorial 4.4.
Idea: I could use chapters 3 and 4 to create a survey for people hiking in Colorado to report Mountain Pine Beetles. Chapter 4 can be used to create the survey and map with POIs, and chapter 3 can be used to make an infographic about Mountain Pine Beetles and include maps of where they are located.
Chapter 1: Web GIS allows users to share geographic information with anyone. It is also low-cost, easy to use and maintain. It has many uses, such as data management, analytics, and supporting decision-making. Each user can create and join groups, share content, and include specific metadata to help further their content reach. Data is published to web layers, which are added to web maps and scenes, which, along with tools, are used in apps. Types of data include CSV, shapefiles, and JavaScript. There are also a multitude of layer types: feature layers, vector tiles, image layers, and OGC standard layers. Web maps are 2D and scenes are 3D. They can have multiple layers. Tools perform the analytical tasks, such as geocoding and summarizing data. Apps are the map-centric programs that can be used on all devices. ArcGIS Pro is an app. There are multiple types of users: viewer, storyteller, editor, and creator. Each map is composed of basemap layers and operational layers. Basemaps provide map context, and operational layers are layers you can interact with. Feature layers are the most common type of operational layers. Feature layers have vector data and can be hosted or non-hosted. Hosted data is directly from ArcGIS. Non-hosted data is from the user. When completing the tutorial, I had a bit of trouble finding certain features because the instructions didn’t exactly match up with what I saw on my computer, but after a little bit, I was able to easily find everything. I really enjoyed being able to do this on my personal computer, and the tutorial was very helpful in using ArcGIS online for the first time.
Chapter 2: ArcGIS smart-mapping allows you to change the style of a map so it can support your message. The map styles are heat map, color and size, compare A to B, relationship, dot density, predominant, type and size, continuous timeline, and vector field. A pop-up shows geographic information and defaults to a list of attributes and values. You can format the pop-ups to be in the style that you want. ArcGIS Arcade allows you to alter data when you don’t have access to do so. It is a language written for ArcGIS to style, label, and add values to pop-ups. For example, to calculate the weekday of the crime events, you type “Weekday($feature.Reported_Date_Time)”. It is similar to Excel formulas. ArcGIS Living Atlas provides content for operational and basemap layers and has thousands of options. Stories have maps, a narrative, and multimedia (who, what, where, when, and why). In the StoryMaps Builder, there are blocks and the block palette. A block is a component in your story, such as text, image, or a sidecar. The block palette combines all blocks into a menu so you can add any block to your story. A sidecar creates a side-by-side reading experience. A slideshow block uses horizontal scrolling and allows your content to fill the screen. A map tour block allows you to create a guide of locations. A swipe block allows you to compare two maps. A timeline block creates a series of events. Express maps allow you to quickly create reference maps on which you can draw features. The tutorial was a little longer, but the result was really cool. I like the swipe map.
Application idea: I could use chapters one and two to create a story map that talks about soil attributes and how they differ on hills and near water sources. The story map would include a map with the location, texture, and elevation.
Hello, my name is Kathleen, and I am from Dallas, Texas. I am a junior majoring in astrophysics with a minor in environmental science. I plan to work in meteorology or compact object research.
I took the quiz, and I did the ArcGIS online account setup in GEOG 291.
When exploring my account, I found that the help section has a multitude of resources, such as blogs, tutorials, and setup help. Also, the online community is active and has a surprising amount of community types, such as Python and roads and highways.
While reading through the get started pages, I noticed that there are a lot of keyboard shortcuts for Mac when editing map layers. I also learned about floor-aware maps, which can show floor plans and are helpful when looking at optimizing large spaces.
I am glad the training course went so in-depth on the types of sharing. I really enjoyed the activities they provided; they helped me solidify the content from the readings.
The two courses I found most interesting are the field-led data collection and management using ArcGIS course and the ArcGIS field maps migration guide course.
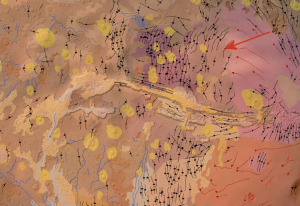
Application 1: Spatial analysis using ArcGIS of the Valles Marineris region of Mars during the 2018 global dust storm
Description: They used ArcGIS to superimpose their data onto a geological map. This shows the distribution of dust with the Valles Marineris terrain.
Link: http://www.jsussenbach.nl/Mars%20en%20ArcGIS_JBAA.pdf
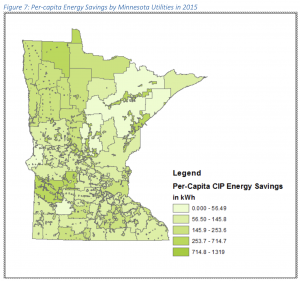
Application 2: Conservation Improvement Program in Minnesota: Addressing an Organization Challenge with ArcGIS Online
Description: This study focuses on creating a story map in ArcGIS online “to benefit Commerce staff by presenting easy-to-understand CIP quantitative and qualitative information for a legislative or general public audience”.
Link: https://conservancy.umn.edu/bitstreams/7ac2d94a-20a3-4255-ab24-c8f978f54e48/download