McMahon Week 4

Chapter 5:

The chapter starts off by defining ArcGIS Enterprise as just a variation of ArcGIS Online that has differences between public and private cloud. It also shows that portals, servers, web adaptors, and data storages are what compose ArcGIS Enterprise. It also shows the importance of portal collaboration through different organizations. The chapter also goes into explaining vector tile layers which are essentially how many ways a map can be divided into smaller portions. The chapter also includes the different ways in which layer types can be chosen and the different benefits from each choice, all portals have access to publish to ArcGIS Enterprise, but some don’t have access to ArcGIS online.

Application: This chapter’s application was helpful in practicing how to publish vector and raster tiles. I thought it was interesting to view both of the maps side by side and overall it was pretty simple to follow the steps for applying the tiles. I ran into a problem when publishing , so I added timezones and that fixed the problem. I did think the app launcher was interesting and I liked adding my work with text in more of a presentation. Overall I thought this chapter was interesting and helpful to compare the different tiles. Overall I liked this chapter and I thought it was pretty easy to fallow along with without many obstacles.

Chapter 6:

The chapter starts by defining real-time GIS as objects that move and how it is important to have mobile GIS so therefor those objects can be tracked and recorded. These changes were identified as moving, discrete, stationary, and change. I was able to read about how real-time GIS can be recorded at a point in time or a duration of time

Application: For this chapter, I was able to create dashboard apps and edit them based on the data. I was able to add elements for charts, lists, and maps. It was interesting to add the gauge because I feel like that is something we haven’t been able to do yet. I was also able to drag and insert new elements and change their structures. I was able to use the category selection tool to edit the elements and get them on the large data sheet. I did run into a problem later in the chapter with the coding. I tried a couple of different ways and made sure that I was putting the code in right and it still wasn’t coming up for me to continue. So overall I was only able to make the pie chart, map, list and graph.
McMahon week 3

Chapter 3:

The chapter starts by identifying what an experience builder is and its importance. The chapter also introduces widgets such as basic and layout widgets and how to use them. Throughout my application, I thought it was interesting to view the 2D along with the 3D map. This application allowed me to create widgets on the map and layer the data through a web experience. I was able to go through multiple layers and pages on this chapter and layer them together to compare the maps. I liked the aspect of being able to add more media such as text layers and photos to explain more about your map.

Chapter 4:

This chapter begins by expressing the importance of mobile GIS and how interactive data collecting is at the forefront of advancements. The chapter also defines editor tracking which is the ability to track the changes made in the data or feature layer. The chapter also identifies all the capabilities that map-centric data can offer, which in summary is just the ability to access and use it whenever and wherever. The chapter gave a lot of  examples of mobile apps and showed ways in which GIS can be connected.

In the application, I was able to look at data and locations of recycling, composting, and other waste management across a given space and add labels. I was able to add layers and conduct a survey for the data which I thought was interesting. Overall I thought that this chapter expanded on the connection that GIS has to people by using mobile devices and other forms of technology.

McMahon week 2

Chapter 1:

From chapter 1, it starts off by giving a brief history of the evolution of GIS and expands on its uses: government, local, business, and public use. I thought it was interesting that the chapter mentions the growth of Arc GIS after covid. GIS provides an opportunity for people to create content but also allows people to discover. The chapter also introduces the term “geo portal” which just refers to the gateway of web sources. Mobile and cloud GIS allow the information to become more mobile. GIS is also expanding its intelligence by using AI to scan and implement data. I liked how the chapter had a chart that represented the main types of GIS and had the privileges and apps on the chart. The chapter also defines tools, base maps, and operational layers, and describes how those components of a web GIS map. Next, the chapter introduces and defines hosted: a situation in which web service in based on Arc GIS- managed data, and non hosted: a situation where a web service connects directly to user-managed data. The chapter explains how photos and other media is important to GIS because it can show things that may be invisible to just the human eye. From the tutorial, I was able to download data and add it to my new file. I ran into a problem by not being able to find the tabs that it was showing in the pictures so that was a little discouraging . But I was able to get familiar to the process of downloading data and looking at the maps in the OWU Maps GIS.

Chapter 2:

This chapter begins by identifying the importance of web layers in GIS. It also defines the different types of layers. I liked the chart that showed the different types of mapping styles with a description and a photo. The chapter also goes into describing the way in which the information is presented almost in a story-like way because of the pop-ups and narration and how they can contribute to the map. In tutorial 2, we were able to upload chapter 2’s data and configure the layers by using the smart map tools. I still had a little trouble navigating through the online website so I think I will probably need to come back to this. But overall I enjoyed reading about new topics and seeing how they applied in the maps.

McMahon Week 1

I have completed the GEOG 292 quiz.

My name is Katie McMahon and I am a sophomore this year. I am from Lancaster, Ohio and I’m majoring in Environmental Studies with a SOAN minor. I am interested in the effects of climate change and analyzing the impacts it has on humans and the environment. I want to be able to look at changing patterns of the environment and I think that GIS is a way for me to gain knowledge in that area. I also like to study human behavior in SOAN and I think that these two disciplines are connected more than we think.

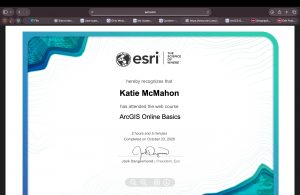
On my ESRI page, I was able to look at my past work and read through some of the basics of GIS. This was helpful because it made more sense now that I have some understanding of map making. It’s important to make maps based on what the viewers need and I think I will gain more practice from the training modules. I was able to look at some articles and maps from the ARC GIS blag page and I thought it was interesting to skim over some of that material. I think seeing this information after working on GEOG 291 will help me gain more understanding in GIS.

For my basic training, I was able to reinstate some ideas that have been brought up in the readings and in the tutorials. I thought the quizzes were helpful because it really reinforced some of the knowledge of tools in GIS. I learned about different layers such as the base layer, and how lines, dots, and polygons are the three main components for map making. I also learned about how web maps are important in displaying information. One thing I thought was interesting was the indication of fonts and italics on bodies of water compared to the font for land. Lastly, I was able to gain knowledge about the different types of maps for groups, organizations, public, and private.


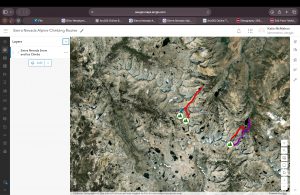
For my map in my module, I was able to download data of hiking trails in California. After, I labeled each trial and indicated the peak of the trial by using a mountain symbol. I lastly added a geographical base map to showcase the land formations around.