Redman Week 3

Chapter 3:

This chapter gives an inside look into the ArcGIS Experience Builder and explains why and when to use it as opposed to using basic configurable web apps. Experience Builder allows for use of more features, choices, visual control, and flexibility of interactive web app design. Benefits of this include: making responsive web apps without writing any code, combining 2D web maps and 3D web scenes into a single view, working smoothly across desktop computers, tablets, and smartphones, and setting up actions so that different widgets can interact with each other automatically. The chapter explains the main building blocks of an app (pages, windows, templates, themes, data sources, and widgets). Pages and windows are used for structure, themes allow certain visual designs, data sources add web maps or feature layers. Widgets are split into functional tools (maps, tables, charts, dynamic text boxes, and filters) and layout tools (sections, rows, columns, and sidebars). Experience Builder comes in three editions: ArcGIS Online, Portal for ArcGIS, and Developer edition, which lets you build custom widgets.

The tutorial for this chapter explains the step by step process for making a complete web app that displays historical earthquake and hurricane data using both 2D and 3D map views. The tutorial begins with picking a template, adding 2D map and 3D scene data sources, and creating section views to allow users to switch back and forth between map views and data summaries. It demonstrates how to set up map triggers so that panning or selecting features in the 2D map updates the 3D map automatically. It also explains adding dynamic summary statistics inside of a text box, building an interactive attribute table, and configuring a widget controller to house Filter and Chart widgets. It then walks the reader through creating a multi-page web app with navigation links in the header.

Application: Creating an economic development web app for Delaware County. This app would combine 2D land maps and 3D building models. Users would be able to filter available commercial properties by acreage or zoning type using a table and chart widget, and selecting a property in the table would zoom both maps directly to that spot. It would also allow for both city planners and business owners to visualize local growth potential across different townships.

Chapter 4:

This chapter involves mobile GIS and field data collection apps. It shows how location tracking, mobile workflows, and web mapping tools are used to gather, update, and manage geographic information directly in the field. Mobile GIS makes Web GIS technology available for field workers, allowing them to record data, perform asset inspections, and track locations accurately. The chapter talks about three primary ArcGIS mobile applications: ArcGIS Field Maps, ArcGIS Survey123, and ArcGIS QuickCapture. Field Maps uses map layouts to collect data, display smart forms, and connect to high-accuracy GPS units. Survey123 uses form surveys with smart display logic created through XLSForm design. QuickCapture uses large buttons to make capturing data quick and simple while moving in vehicles or on foot.

The tutorial in this chapter shows the reader how to set up a full field data collection workflow. It shows how to create feature layers with fixed drop down rules (domains) and subtype settings, build smart forms with required questions and dynamic visibility rules, configure offline map areas for locations that lack cell service or internet connection, and collect data on a mobile device that updates an online web dashboard being used.

Application: Creating a park asset inspection app for city maintenance workers across community parks in Delaware County. Staff working in the field would be able to use mobile devices to report damaged playground equipment, snap and upload photos, select repair priority levels from drop down menus, and send reports back to an administrative dashboard. This would allow for faster repair time, improvement of public safety, and up to date records in the parks.
 

Redman Week 2

Chapter 1:
This chapter provides insight into what Web GIS, what it is used for, and how to use it to portray visual information. GIS has gone from a file-based single computer system to a globally accessible server. It has a large number of advantages including global reach, large number of users, low cost, better cross-platform capabilities, easy use, and easy maintenance. The term GIS has two meanings, the first one being intrinsically science-based, and the second one being a scientific tool. Many organizations use GIS in both contexts. The government uses it to share public information services, businesses use it for advertisement, scientists use it to create research areas, and the general population uses it to plan their daily activities( restaurants, stores, navigation, etc…).

The chapter 1 tutorial for this book guides users through how to make a Web GIS app that shows major points of interest in Redlands, CA. This tutorial starts with publishing a hosted feature layer from a CSV file and adding attachments to it. The tutorial then shows how to add a field to the layer and edit the attributes. You then create a web map before creating an instant web app using this information.

Application: Creating a map of the Marion county school districts, centering on the main administrative offices of each district. Data points would include attributes like the district name, student enrolment numbers, state report card ratings, and the address of each building. Using this application, users could view each district while obtaining important information.

Chapter 2:
This chapter focuses on web layers and web apps. It shows how smart mapping, custom pop-ups, ready-to-use geospatial data, and narrative storytelling work together to present the data in an easy to understand way. Web layers are the foundation for web applications, and web apps are what users interact with to examine the data. Story maps have become a very popular web application format for sharing spatial findings and geographic information to the public. I have used storymaps in the past for the Animal Behavior class provided here at OWU, and it was very user-friendly. I was able to use it without having any prior experience with it prior. Web layers can be hosted or nonhosted layers. Hosted feature layers are stored directly in ArcGIS online, while nonhosted feature layers are connected to databases.
Smart mapping analyzes dataset attributes automatically and recommends intelligent default styles, color ramps, and symbols. This uses styling methods which include point density, color and size representation for multiple variables, percentage comparison of multiple factors, relationship mapping using bivariate choropleth styles, and Predominant category mapping. Pop-ups are used to make it easier to interact with the map. Pop-ups display text, charts, pictures, and other media. Arcade expressions are used when layers lack specific fields. The end of the chapter talks about storytelling using ArcGIS StoryMaps, which takes maps, media, and text, and inputs it into modular blocks to make the interactive story.

The second tutorial in this book talks the reader through how to geocode a CSV file of U.S. city populations into a hosted feature layer, apply above and below smart mapping styles, configure arcade pop-up expressions and charts, and publish a story app that features 3D web scenes, sidecar maps, and express maps.

Application: Creating a map that shows house prices in Delaware county since the year 2000. This map would show the change in home price values have changed over the years and across different townships and neighborhoods. The points on the map would show median sale prices, average days that a house is listed on the market, price per square foot, and income levels in the area. The app would include a swipe tool to compare home prices from 2000 through.

Redman week 1

I completed all of the assignments for week 1

My name is Kylie Redman, and I am a junior here at OWU. I am majoring in zoology and hope to be a zookeeper at the Columbus zoo. I am taking this course because I think it would be helpful to know how to make maps and interpret them for conservation work. I have used ArcGIS online to make map presentations before, but did not understand much of how they work.

Comments on the online page:

  1. The training tab is very interesting. I did not know that there is so much involved in making maps. This is a very informational site that would be helpful for independent learning and general curiosity. It would also be useful if stuck on a topic, as it would teach how to get through it.
  2. The Community and Forums tab seems like a great way to collaborate with others and share ideas.

Intro to ArcGIS online comments:

  1. Being able to collaborate with others on maps if a great way to ensure the maps are easy to understand
  2. It is very interesting that these apps can be downloaded for use in the field where there may not be a connection. This is a great feature of ArcGIS online.

Online training comments:

  1. I learned a lot in this training course about different ways to share maps and other aspects of the data.
  2. This course was a very helpful tool to learn how to navigate the website and use it effectively.

 GIS Applications:

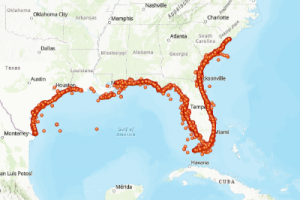
  1. NOAA Fisheries and state agencies use ArcGIS online to track information about sea turtles(health, nesting…) researchers look for and input information into ArcGIS about nest sites, egg clutches, and rescue points across the regions where sea turtles lay their eggs to evaluate population trends and threats caused by humans.

Source: National Oceanic and Atmospheric Administration Fisheries. (2026). Sea turtle stranding data [Feature layer]. ArcGIS Online. https://tucworkshop3.maps.arcgis.com/home/item.html?id=5e3d124258934114a7208ef0aab70dc6 

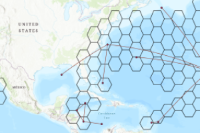
  1. Scientists use GPS satellite tags on sea turtles to follow movement across the ocean. The tag sends location updates, and the software connects the locations dots over time to show turtles traveling to eat, mate, and lay eggs. This helps marine planners to see if there are a lot of turtles overlapping with where there are a lot of fisheries or shipping lanes to better protect them.

Source: Gulf of Mexico Coastal Ocean Observing System. (n.d.). Loggerhead sea turtle movement analysis [Map]. ArcGIS Hub. https://seaturtleatlas-gcoos.hub.arcgis.com/maps/83d16bf85ce24e799804e5dcf5071b03