The blog does not allow you to insert formulas, so here is the file detailing my final.
Author: jzzimmerman
Zimmerman Week 1
Hello, my name is Jack Zimmerman, and I am a senior majoring in Quantitative Economics. I took this course as a general requirement, but I am interested in data analysis and thought this course would be fun. Additionally, my primary area of research is real estate, so I thought this would be an excellent complement to my existing knowledge.
Looking Around:
The overall site layout on ArcGIS seems fairly straightforward and intuitive. I explored some layers created by other students and added them to the map. Data management seems to be something I need to reconcile later.
Getting Started: What Is ArcGIS Online
I spent most of my time in the “Manage content and data” section. Looking at the “Perform analysis” subsection. It seemed interesting, but I think I will stick with doing analysis with R Studio. The primary issue was that data must be publicly available, which is something I can’t do with the data I want to use. The second issue is ArcGIS’ credit system. Doing analysis requires credits, and I have already used all of mine to import some data. Next, I looked at the “Manage content and data” section. Overall, this section was pretty unhelpful, and it just told me stuff I already knew. A few of the embedded links inevitably led me to some helpful articles on data management. However, I still need to do further reading.
Web Course: ArcGIS Online Basics
This was okay. I found myself just using the book and just skimming over this.

ArcOnline Applications:
I know I want to do something with real estate, so I looked up papers on real estate-based applications. My goal was to find papers on methods and processes for handling data.
Paper 1: Laban, K. N. (2017). Integrating Gis and Real Estate Management Systems to Market and Manage Facilities on the Web (Doctoral dissertation, University of Nairobi).
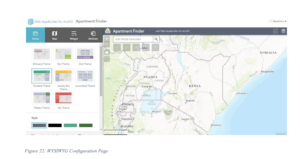
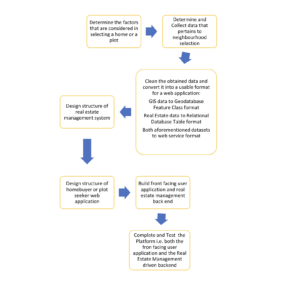
The first paper I looked at, “Integrating GIS and Real Estate Management Systems to Market and Manage Facilities on the Web,” discussed combining real estate management systems with GIS maps. This paper is super detailed (121 pages detailed) and includes information about cleaning and analyzing data. Below is an outline of the process used in the paper and one of the websites created.
Paper 2: Kwon, P. (2012). Analyzing Southern California Residential Real Estate Prices: A Spatio-Temporal Approach.
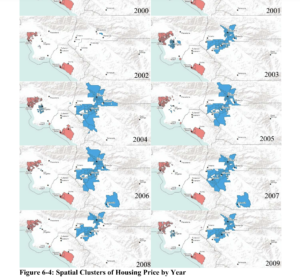
The second paper I looked at, “Analyzing Southern California Residential Real Estate Prices: A Spatio-Temporal Approach,” analyzed both spatial and temporal autocorrelation patterns in real estate data. The approach taken by the paper to analyze the data seemed a bit too simple but was nonetheless interesting. I think the paper also made a few mistakes in how they clustered the areas and conducted the tests, but they somewhat fixed it in the end. The paper used Moran’s I as the metric to measure spatial autocorrelation. I hadn’t heard about Moran’s I, but I did look it up, and it is very similar (mathematically) to other correlation measures, such as Pearson and Spearman. However, the way the paper implements it seems to make percentage changes in housing prices a function of inverse distance. This doesn’t seem appropriate since variation correlated to the percentage change in housing prices usually exists exogenously, not at the spatial level. Anyway, I went way too deep into that. Here’s an image showing the clusters of housing prices over the years.