Payne Week 4

Payne Week 4 

Chapter 5 talks about how ArcGIS Enterprise allows organizations to build high performance WebGIS systems through on premises hosting and tile caching. Unlike ArcGIS Online Enterprise runs on private servers which gives organizations flexibility to match their needs. Tile caching is a big focus in this chapter and is a technique where map tiles are pre-rendered at different scales so they can be quickly ‘delivered’ to users rather than being generated every time a request is made.This makes working with large datasets on smaller devices like phones much easier. This chapter also discusses different layer types such as raster tiles, vector tiles, map image layers, and feature tiles. I found this chapter a little more confusing and technical than some of the others and I had to reread a few parts but after that it was easy to understand. 

Chapter 6 goes over spatiotemporal data, which is information that tracks where things are and how they change over time. GIS tools like ArcGIS Velocity and ArcGIS Dashboards can take the raw information given from this data and turn it into something useful and visual. The concept of spatiotemporal data seemed to be pretty straightforward but I think that it would be a challenge to both handle the large amounts of data that are collected on a daily basis and to create a successful visualization of the data that leaves out the non important information. 

Possible applications: With modern weather apps and navigation apps collecting so much data I imagine there could be an interface where severe weather patterns are mapped alongside directions to allow drivers to know what is coming in real time. An example of this would be if you were driving down the highway in light rain but there is a pocket of very heavy rain with limited visibility ahead and your navigation app could both warn you and give a real time radar image that is laid over your navigation screen. 

Payne Week 3

Payne Week 3 

Chapter 3: This chapter starts by introducing the Experiences Builder which is a primary tool in this chapter. This tool deals with 2D and 3D data and seems to be pretty tuneable to what you need. This tool was pretty easy to use and get used to. The step by step tutorials helped clear up a little bit of confusion I had with the tool and I only had to go back through a few sections of the tutorials. I overall struggled a little with this chapter but not anymore or less than I have with the others. 

Chapter 4: This chapter focuses on how to build mobile GIS apps and the benefits of doing this. A large focus is how the use of this allows for more accessibility to a larger audience of people as practically everyone has a phone on them. After the introduction of this the chapter focuses on the three step process/approach to building mobile apps with GIS. These three different types of approaches to building a mobile app are browser based, native based, and hybrid based. The last part of the chapter describes different useful Esri mobile apps and what they are meant for. 

Possible application: One possible application could be creating an app to map and track animals’ trail uses over time and include data such as daily weather, seasons, and elevation to try to identify patterns with certain groups or species of animals. 


Payne Week 2

Payne Week 2 

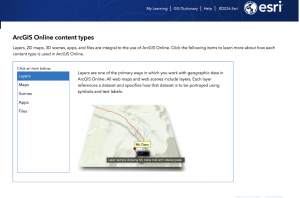
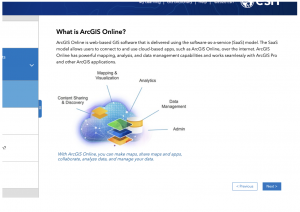
Chapter 1 describes how Web GIS has made geographic information more accessible and widely used across different fields including form government and business. It highlights how the system works by organizing data into layers, maps, and apps, allowing users to analyze and share information easily. The chapter also explains key concepts like hosted data and non-hosted data. In addition, it introduces different types of users and roles, showing how people interact with GIS in various ways. The difference between 2D maps and 3D scenes is also emphasized along with the tools used for analysis and visualization. Overall, the chapter demonstrates how Web GIS is a flexible user-friendly system that supports collaboration, data management, and decision-making. 

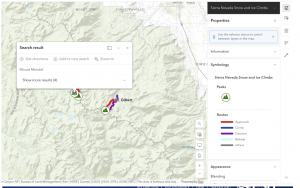
Chapter 2 focuses on how Web GIS can be used to present and communicate data more effectively through mapping and storytelling tools. It explains smart mapping, which helps users choose the best visual style, such as heat maps or comparison maps to match the message they want to convey. The chapter also introduces pop-ups and ArcGIS Arcade which is a built-in expression language that allows users to customize data, labels, and displayed information. Another key feature discussed is the ArcGIS Living Atlas, which provides a large library of data for maps and layers. The chapter also highlights storytelling tools like StoryMaps where users can combine maps with text and multimedia using different content blocks. 

Application: A cool application of this could be to create a story telling map about your heritage and where your ancestors are from to form a sort of family tree map. 


Payne Week 1

Payne Week 1 

Hello my name is Jack Payne and I am a senior here at OWU, I also took GEOG 291. 

I have access to ARCGIS online from 291 

Under My Esri I found articles under the infrastructure tab about various uses of the site and upcoming events and what not in those areas. Under my settings I found and area where you can change your units between standard and metric. 

Working through the introduction to ARCGIS online I found the map viewer section and read through it which reminded me of the little bit of work we did with it during GEOG 291. While clicking through the other side tabs I found it interesting how many interactive options there are in ARCGIS online and how many coding options there are, which I did not entirely understand as I have never coded before, but it was still interesting to rear through. 

Doing the Online basics training I learned about how to share maps depending on who your audience is going to be and I also found out about 2D and 3D visualization tools for these maps. I found it surprisingly simple to navigate through this course and the map creation segment.