J Bailey Week 4

Week 4

Readings from Getting to Know Web GIS (Chapters 5 and 6) Mmaking web maps run faster behind the scenes and bringing live, changing information onto the screen.

Chapter 5

Explained two interesting ideas First map caching and hosting maps on private servers. Caching is basically like taking snapshots of a map at different zoom levels ahead of time. Instead of making a computer redraw every single road, river, and border from scratch every time someone scrolls or zooms, the map just loads premade image tiles. This makes web maps feel smooth and instant. The chapter also compared using public cloud tools like ARC Online GIS with running your own private, on-premises system. Cloud tools are nice, places like hospitals or government agencies like to keep everything on their own local servers for security. Working through the tutorial went oakay.  Button names in the software looked  different from the textbook screenshots  I spend most of my time trying to figure out where the correct butttons are….

Chapter 6

Turned from static maps to live, time based data. Instead of looking at a single  moment, spatiotemporal GIS lets us track how things move and change for instance like watching weather patterns roll across a state or tracking buses in real time. Setting up time sliders in the lab really showed me how adding a clock to a map turns a chart into an story.

Reading these chapters left me with a couple  questions..    If  premade map tiles are great for speed, how do developers keep maps fast when the data is changing every few seconds?  How big does a company or project need to get before running private servers makes more  sense financially than just paying for cloud storage?

Another one of my  own project ideas is that id like to build an interactive map tracking local campus routes or pedestrian foot traffic routes at Ohio Wesleyan. By putting  a fast, cached background map of campus pathways with time stamped GPS or sensor data from throughout the week and students could use a time slider to see exactly when and where campus gets busiest?
J Bailey Week 3

Chapter 3

Working from basic Web AppBuilder to ArcGIS Experience Builder is basically like upgrading from a basic PowerPoint layout to a completely custom website designer. Instead of getting stuck in a premade template where you can only change a few colors, Experience Builder gives you total control. You can drag and drop map tools, images, text, and buttons wherever you want, and even build multi-page web apps without needing to write a single line of code. What makes it so useful is how it turns simple map data into an interactive visual dashboard. You can display 2D maps, 3D views, photos, and text side by side. It also lets different parts of the screen talk to each other. For example, if someone clicks a building on the map, a list next to it instantly updates to show details about that specific spot. 

Chapter 4 

Goes into Mobile GIS, which basically takes map data out of the computer lab and puts it right onto your smartphone or tablet. The biggest takeaway is realizing just how much we interact with location data every day without thinking about it—from food delivery apps tracking drivers to weather apps pinpointing storms. Instead of just viewing static maps on a desktop, Mobile GIS allows anyone in the field to collect real-time data, update map layers on the spot, and snap geotagged photos using specialized mobile apps.
The chapter breaks down several key tools, each built for a specific kind of field work. ArcGIS Survey123 feels just like creating a Google Form, but every response automatically links to a specific point on a map. ArcGIS QuickCapture is designed for high-speed data collection, like tapping a single big button on your phone screen while riding a bike to log road damage or tree locations instantly. Other tools  lettyou view hidden GIS data layered directly over your phone’s camera view of the real world. 

You could use a custom dataset that would be a Interactive Campus Recycling & Sustainability App. The main screen could feature a map showing every recycling, composting, and e-waste bin across campus. Users could click quick filter buttons to show only specific bin types, like electronics or aluminum. Clicking a bin location on the map would immediately open a side panel with photos of what goes inside and the pickup schedule. You could even add a second tab that takes users on a guided virtual tour of campus green spots like solar panels and community gardens. Experience Builder makes combining all these moving pieces easy.

J Bailey Week 2


Chapter 1

Web GIS is like building a digital map from scratch. You have data, raw information, like a spreadsheet containing addresses or locations.  Web Layers are taking that raw data and putting it online so it shows up as shapes, points, or lines on a screen. Web Maps combine your data layers with a background map (like satellite imagery or a street map).  Tools, built-in functions that help you search, measure distances, or analyze area details. Web Apps, the final, easy-to-use webpage or phone app where non-technical users can tap on map locations to see photos, details, or reports. Two-Way Information,  people in the field can use phone apps to upload photos, reports, and new map locations directly to the cloud in real time. Cloud Storage, everything is saved online, making it easy for teams to work together from anywhere. 3D & Interactive Visualizations,  Maps have upgraded from flat 2D images to full 3D models and virtual reality views.


Chapter 2

 Getting to Know Web GIS focuses on how modern digital mapping tools allow anyone to craft visual, interactive stories using spatial data. At the core of this chapter are feature layers, which represent vector geographic features like points, lines, and shapes on a map. Unlike traditional static maps, web feature layers are interactive and drawn directly by your computer or mobile device. This interactive nature allows users to click on specific locations to view dynamic pop-up details, filter information on the fly, or even submit real-time data directly from the field.  To make raw geographic data meaningful and visually appealing, the chapter uses smart mapping technology. Smart mapping acts as an design assistant, analyzing spatial data attributes to suggest the best styling choices, color palettes, and proportional symbols so that both beginner and experienced map maker.   Pop-up windows can be enhanced using simple custom logic and arcade expressions, enabling maps to display  text, images, and embedded charts instead of plain text lists.


J Bailey (Week 1)

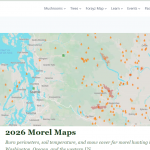
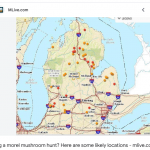
Hello, My Name is Janie Bailey I completed GIS 291.  I also completed my Quiz for GIS 292.  I am Majoring in Enviromental Studies.  This year I am  a Senior.  I logged into my account and finished the introduction to Getting  to Know Web GIS.    I learned about the advantages of web GIS and ESRIS geospatial Cloud and sharing with different groups and the privacy settings.  I added layers to a map that helped identify connecting paths .   Viewing the 3D web Maps was fun. I actually felt like I was physically in the location I was viewing.  I completed the introduction and obtained my certificate.  I am a Morel mushroom fan so I found a  arc online Mushroom  map .