Isaacs Week 6 (Final)

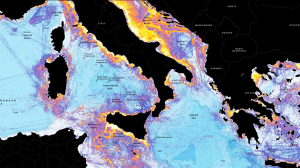
My first application I found data using the atlas on live stream gauges in rivers and streams all across the United States. I opened this map and found there was a lot of data useful and able to change from things I learned specifically chapter 2. I messed around with changing the color of different water levels making red high or flooded level and blue low or regular level. I could also change the size of the bubble to how high the water level is.  I also added an attribute of USA Short-Term Weather Warnings to show where water levels may rise because of a storm. This map can be useful to fisherman any where around these rivers and streams. For example if a fisherman wants to see the water level of Alum Creek at the present time and compare it to the level of the Olentangy River they can click on the river location and see the exact height at that given time. 


https://owugis.maps.arcgis.com/apps/mapviewer/index.htmlwebmap=ce1547fd4cd0426398301663978dc896

The second application is making a map that charts the location of a fish catch and other information like weight, size, location, and any other description about the fish you want. This could be useful for tracking a fishing tournament when you are trying to track where the biggest fish were caught. It can be used by a tournament director for tracking lots of fishermen’s weights over a period of time. It could also be used by an individual fisherman who just wants to find out where he catches most of his fish. Using chapter 6 I used gauges on a dashboard to display the sum weights of different areas where a fish was caught. There is also the original map of the locations of the fish catches on the dashboard. This is just an example I made up using hypothetical fish catches in the pond in front of Meek Aquatic Center. 

https://owugis.maps.arcgis.com/apps/dashboards/5ca290f675a64cacab1f327622bfe4dd#mode=edit

Isaacs Week 5

Chapter 7 was interesting learning about how 3D models are made and the different ways they are used. The chapter focused a lot on to make maps more realistic and easier to understand. Instead of just looking at a flat map, you can see things like buildings, terrain, and other features with height and depth. It explains how tools like ArcGIS Scene Viewer let you explore, create, and customize these 3D environments. The chapter also goes over different types of 3D data, like feature layers and scene layers, and how elevation plays a role. Overall, it shows how 3D maps help people better visualize real-world spaces and make smarter decisions. The tutorials were fairly easy to follow with the exception of a couple parts that I had to look up. It definitely helps already knowing where a lot of the tools are on ARCGIS Online. I also thought editing and seeing the visuals on screen viewer were very cool and you could see how complex the tool can get.

An application for this chapter could be a 3D model of the bottom of a lake with depths and structure underwater. This could be a website that someone makes and makes it easier for fisherman to find drop offs and good fishing spots where fish might congregate. I could also be a tool just for overall boaters to give them warnings where shallow parts of the lake are and where to avoid. 

Isaacs Week 4

Chapter 5 was interesting to work on. It focused on the ArcGIS enterprise which was a little confusing at first. I learned about what caching was and why it is important especially for highly accessed sites. This chapter also contained a lot of graphs and charts explaining how files work and operate. The steps on ArcGIS were pretty easy to follow and didn’t cause many issues. It was interesting to see the difference between raster and vector tile layers and things like how they are stored or updated.

Chapter 6 focused more on the visualization of the data developed and talked about it chapter 5. I thought this was interesting to visualize and actually see what was going on. This chapter also gave a bunch of pictures and charts to show how things are related or work together rather than just explaining it. When working on the tutorials in ArcGIS online it took a little bit of time to follow the steps and complete it. Taking a computer science and programming course it was also cool to see how coding comes into play in this chapter as well. Overall, I thought the chapter was interesting and important for learning how to use GIS.

An application involving these chapters could be a fisherman tracking where they caught fish on a lake. You could make the map use caching so the map is quick and easier to load. Once the person catches a fish you could use a gauge to chart how many fish they caught and the total weight or length of the fish.

Isaacs Week 3

In chapter 3 I used web maps building and adding layers and just learned how to use them overall. It was cool to play around with this and add themes and stuff. I found where I could add data and themes from the organization and had tons of options made by other OWU students. I thought some of the visuals you could create and add were very cool too. The work for this chapter was fairly easy to follow along with and could get around and simple problems.

Chapter 4 was more covering making web apps. Like the past chapters there was a lot of playing around and trying different things to see what they do. It taught how to use widgets like search and legend which was cool to see. I thought it was interesting there was a part where you would use your mobile app. Overall, I learned a little how to publish and configure web applications while adjusting them to what I need. 

An application that could be used through these 2 chapters is mapping fish habitat. You could chart their spawning grounds or nursing habitats. You could separate these using lake depths or places the fish prefer. Other applications in fishing might be to map environmental conditions, fish pressure tracking, angler report apps, or surveys like fish or bait stockings. There are a lot of different possibilities in fishing to use stuff learned in these chapters.

Isaacs Week 2

In chapter 1 I struggled a little bit finding where everything was including the files I had to download. I eventually figured out where they were and what I had to do. After that it was pretty smooth sailing there was a couple spots that I got stuck and had to look up where to go or retrace my steps. Overall, I thought it was cool to navigate through and learn where things were located at. 

Chapter 2 was more complicated and took longer to work through. It was still interesting to read about the different possibilities with using this program. I thought the geocode part was cool since I am a Data Analytics major and have taken some computer science. It was cool to see the simple code and how it performs in making things like maps. I also liked how the layers worked and how everything you do doesn’t have to be made by you. There are already made to use layers built in to make things quicker. 

An application that would be interesting based off these chapters would be making a map for fishing. I could have different spots for fishing with conditions or basic things about the area or maybe what species of fish it carries. 

Isaacs Week 1

I am Henry Isaacs I am from northern Ohio and am a sophomore at Ohio Wesleyan University. I am on the Baseball team here and am a Quantitative Economics and Data Analytics major. 

I completed the quiz. I have access to the ARCGIS account from 291.

Through exploring around in the Esri pages and training I found that there a lot of different trainings you can do and some of them take a significant amount of time like one took 6 weeks. I also found that some of the pages like the ARCGIS Pro page wasn’t available at the time. 

On the Get started page I found out that you can collaborate on projects with other people from out organization which would be cool. I also learned about the scene viewer tool and how you can visualize things in 3D.


https://www.esri.com/about/newsroom/arcnews/illuminate-fishing-activity-on-the-open-ocean

I have completed the Web Course: ArcGIS Online Basics training and thought it was a good refresher of what it ARCGIS is and its many applications. I thought it was useful and even taught me new stuff like when creating and editing web maps. 

The first GIS application I looked into is fisheries management. This application is useful for providing information specifically to where fishing activity takes place in the world. The website showed how you can create maps to show density on fishing activity and other interesting visuals. 


The next application I looked into is the application to stream and river fisheries. Using GIS you can map and model habitats with different aquatic life. The website mentioned how this use of GIS is inter

esting because rivers and streams are always changing. 

https://www.researchgate.net/profile/Frank-Rahel/publication/291005722_Introduction_to_geographic_information_systems_in_fisheries/links/6760c01ae9b25e24af5c5240/Introduction-to-geographic-information-systems-in-fisheries.pdf