Njoroge Week 4

Chapter 5:

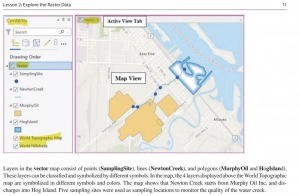
I found Chapter 5 of GTKWGIS very interesting. It touched on some very important Web GIS features, including raster tile layers (which deliver maps as image files in the PNG or JPG format) and vector tile layers (customizable data that delivers maps as grouped vector files in the PBF format). The chapter’s tutorial also has a great guide on how to use them effectively to create a web map, which was very helpful.

The chapter also talked about ArcGIS Enterprise, which is a variation of ArcGIS Online. While it has some key differences, it includes several configurations, such as on-premise and online/cloud availability.

Application:

One application I can think of based on the content in Chapter 5 would be an environmental conservation organization comparing a vector and raster tile layer of the same forest to track deforestation rates across (for example) a 20 year time interval. The raster layer would be the older layer of the two, due to the fact that raster layers are more static/unchanging than vector layers.


Chapter 6:

I thought Chapter 6 of GTKWGIS was quite interesting, as it discussed some more real-life uses of Web GIS that I could be implementing in my final project. The chapter went over Web GIS features like IoT (a network of physical objects embedded with sensors and network connectivity that allow these objects to connect and exchange data) and ArcGIS Velocity (a real-time GIS product that provides real-time analytic features, feed items and big data analytic items.)

The chapter also went over ArcGIS Dashboard, which provides a comprehensive view of the resources and systems you are using. It integrates web maps and a variety of data uses to provide you with the best overview of your project. This includes charts, lists, and indicators that can update automatically if need be. One question I did have about this feature is whether AI could be successfully integrated into the model, to allow for the production of predictive analytics based on previously seen data.

Application:
One application I can think of for these functions would be a researcher using IoT to track an endangered bird species in their natural habitat or a national park. The IoT could track migration patterns, bird rates as well as mortality rates over a long period of time.
Njoroge Week 3

Chapter 3:

I found Chapter 3 very informative, as it discussed the features of WebGIS that allow the user to add important features like widgets onto a web map. The chapter also talked about the different types of widgets, such as basic widgets (functional widgets that can perform as app tools), and layout widgets (containers that help organize widgets on your page or windows). The tutorial within the chapter also allows you to practice adding and editing widgets on a web map, and I found the hands-on portion of the chapter very informative.

The chapter also talks about the basics of WebGIS Experience Builder, which allows the user to to create unique web experiences using flexible layouts, content, and widgets that interact with 2D and 3D data. With the Builder, you can make templates for mobile-adaptive apps, and later modify them for a variety of screen sizes. Mobile apps could also be constructed from the Builder, as the user has a large amount of creative freedom.

One question I had about the use of widgets is whether programming languages other than JavaScript and HTML could be used to create/edit their functions, or if they are restricted to these 2 languages.


Chapter 4:

I found Chapter 4 of Getting To Know Web GIS very interesting. It talked about 2 functions I found very fascinating, 1) Mobile GIS/ app development and 2) tracking features within Web GIS. I found it interesting to learn about the different advantages mobile GIS has over traditional desktop, such as increased mobility, ease of data collection and near-real-time information.

Additionally, the chapter also discusses ArcGIS Indoors, a mobile app that provides an in-door mapping experience for understanding the locations of things and activities happening within your organization’s environment. There are several capabilities available within the Indoors app, including way finding/navigation, launch actions and calendar integration.

In addition, I found it interesting to learn about the different mobile app development strategies, such as the more traditional browser-based approach and the hybrid-based method, which involves uploading HTML and JavaScript contents into a native app. One question I did have about the chapter comes from this section; 3 methods were listed as ways one could develop a web GIS mobile app, and while looking through them I wondered whether there were any other methods of mobile app development, or if other development methods are currently in the works.


Application:

One application I can think of from both these chapters is a national park (eg. Shale Hollow Park) creating a mobile app that would allow users to navigate the park without getting lost. Users can find the quickest route to different features of the park from their location using the way finding feature, and find 3D projections of the park’s layout, if the app was developed using the Experience Builder that was discusses in Chapter 3. This would allow users to get a more in-depth view of the park before they decide to visit/hike to certain features.

Njoroge Week 2

Chapter 1: Getting To Know Web GIS:

I found this introductory chapter very interesting, as it gave a brief history of the origins of GIS, and how GIS was first developed in the 1960s by Roger Tomlinson (who developed the Canada Geographic Information System). The idea was later developed by the the Palo Alto Research Company, who developed a mapping webpage in order to track and manage their projects, which was the original web GIS.

I also found it quite interesting to learn how ArcGIS Enterprise and ArcGIS Online are being utilized by many multinational companies in order to track their growth and development, as well as those of their competitors. One application I thought of for WebGIS from this chapter was a webmap detailing the Hydrology of the state of Ohio, including stream orders and which hydrological systems feed into each other. This can be used by organizations such as DelCo Water, which operate in the realm of water treatment and anti-pollution efforts. However, one question I had was whether data that can be used to construct a webmap in WebGIS is limited to forms such as CSV, shapefiles, GPS Exchange Format (GPX), JavaScript Object Notation (GeoJSON, and whether other forms of data compilation and coding could be used.


Chapter 2: Getting To Know Web GIS

The second chapter of “Getting To Know WebGIS” was also quite informative. It was very interesting to learn about ArcGIS Living Atlas of the World, which provides ready-to-use content in the form of tens of thousands of data layers and maps. It was also very interesting to learn about the range of data available in the Living Atlas, including information on basemaps, infrastructure and even people.

I also enjoyed learning about ArcGIS StoryMaps, and how they can be used to construct a narrative or track the development of a certain region or regions anywhere in the world. One application I can think of for this function would be a StoryMap that tracks the infrastructural development of a town in Pennsylvania from the year 1976 to 2026 and getting to see, for example, how different buildings and structures get demolished to make room for others.

However, one question I did have while reading this chapter would be what type of coding language ArcGIS Arcade utilizes, and whether multiple languages can be used depending on the user’s comfortability.

Njoroge Week 1

*Has completed all assignments for Week 1*

My name is Ariana Njoroge, and I am a Junior here at OWU. I am double majoring in Environmental Studies and Geography, with a minor in Psychology. Some of my favorite things to do include reading, listening to music, drawing, crochet, and hanging out with my friends 🙂


While looking around My ESRI account, I found that the site had a lot of useful information to help get you familiar with not just ArcGIS Online, but the ArcGIS Pro app itself, which I had not expected to find. Additionally, I enjoy how collaborative ArcGIS Online is compared to ArcGIS Pro, which does not allow you to collaborate with others on maps and projects as easily.

During my read through of Get Started: What Is ArcGIS Online, I found it interesting how demand levels for certain web map layers (eg. hiking routes in Sierra Nevada) can change can change how much of your internal resources you can use. In addition, I also found it interesting that you can also use ArcGIS API for Python using ArcGIS Notebooks to run data science scripts to get insight into your data. I have been interested in getting into coding while I am in college, so this may be an application I utilize often.

While doing Web Course: ArcGIS Online Basics, I found it interesting how operational layers can be manipulated to less of a degree than within the ArcGIS Pro app, which makes sense due to the fact that ArcGIS Pro can process much more data than ArcGIS Online. Additionally, I found it interesting how you choose to share your content (eg. organizationally, within a group) is something that should be taken into account, depending on the kind of map you are making.


ESRI Courses of interest: Build Immersive Experiences with ArcGIS and Game Engines + Geographically Weighted Regression Analysis Using ArcGIS Pro.


ArcGIS Applications:

  1. Mapping the hydrology of a particular watershed, as well as mapping different stream orders and changes in these stream orders over time
  2. Tracking deforestation by observing changes in Land Use Land Cover.

Source: Source: Purwonegoro, B. Setiawan, Y. Webgis Application For Monitoring Land Use Change In Indonesia, 2022.