Pichardo Week 2

Chapter 1

Chapter 1 introduces Web GIS and explains how geographic information can be accessed, shared, and used through the internet. One thing that stood out to me is how Web GIS makes mapping more accessible to people who may not have experience with traditional GIS software. Instead of only creating maps on a desktop program, users can publish their maps online and allow others to interact with the information. I think this is especially useful because GIS can be applied to many different fields, including environmental science, urban planning, and public services.

Another concept I found interesting is how different layers of geographic information can be combined to better understand an area. For example, looking at land cover alongside roads, streams, and developed areas can help identify patterns that might not be obvious when examining each dataset separately. However, the usefulness of these maps depends on the quality of the data being used.

Question: How can we determine whether online GIS data is accurate and reliable, especially when working with datasets collected at different times or using different methods?

Chapter 2

Chapter 2 focuses on smart mapping and how GIS can be used to communicate information more effectively. I think one of the most important things about creating a map is making sure the information is easy to understand without losing its meaning. The colors, symbols, and classification methods used can influence how people interpret the data, so it is important to choose them carefully.

I also like the idea of using GIS to tell a story about a particular place or environmental issue. Maps can help people recognize patterns and understand relationships that might be difficult to see in a table or written report. For example, combining land-cover data with information about waterways or urban development could help show how human activities affect the surrounding environment. I think this is one of the most useful aspects of Web GIS because it allows people to explore information themselves rather than simply being told what the data shows.

Question: How can we make maps visually interesting while ensuring that the way we present the data does not mislead people or influence them to draw inaccurate conclusions?

Potential Web GIS Application

One application I would be interested in creating is an interactive map showing land-use changes and environmental resources in Delaware County, Ohio. I could use publicly available GIS data to map land cover, streams, parks, and developed areas to explore how development may affect the surrounding environment. If historical datasets were available, I could also compare land-cover patterns from different years to see how the area has changed over time. Using ArcGIS Online, I could organize the information into separate layers and use different colors and symbols to make the map easier to navigate. This project would allow me to apply the concepts from both chapters while exploring how Web GIS can be used to communicate environmental changes and support conservation and land-use planning.
Pichardo Week 1

Introduction

My name is Andrea Pichardo, and I am a senior Environmental Science major at Ohio Wesleyan University. I have experience working with GIS and spatial data through my coursework and a summer internship. I’m interested in learning more about how GIS can be used to better understand environmental issues, especially land-use change, conservation, and natural resource management.

Exploring My Esri Account

While exploring my ArcGIS Online account, I noticed that Esri offers several resources to help users improve their skills and find answers when they run into problems. The Training section provides courses on different GIS topics, while the Help and Community sections offer support and information from other users. I think these resources are useful because there is always something new to learn when working with GIS.

What Is ArcGIS Online?

ArcGIS Online is a web-based GIS platform that allows users to create, manage, analyze, and share geographic information. One thing I found useful is that maps can be shared with other people without everyone needing to use desktop GIS software. I also learned that content can be shared privately, with an organization or group, or publicly, depending on who needs access to it.

ArcGIS Online Basics Training

The ArcGIS Online Basics course covered different ways to work with and share geographic data. One thing I learned was the difference between basemap layers and operational layers. Basemaps provide background information and geographic context, while operational layers contain the data being displayed or analyzed.

I also learned more about the different ways geographic information can be presented in ArcGIS Online. Web maps are useful for displaying and exploring spatial data, while web scenes allow users to visualize information in three dimensions. Apps can also make maps more interactive and easier for people to use.

Esri Training Courses of Interest

Two Esri courses that interest me are ArcGIS Online: Creating and Styling a Map and ArcGIS Online: Performing Analysis. Since I have some previous GIS experience, I would like to build on my existing skills and learn more about creating effective web maps and analyzing geographic data. I think both courses would be useful for environmental projects involving land-use change, conservation, and natural resource management.

GIS Applications

  1. Watershed Mapping and Hydrology

Image:

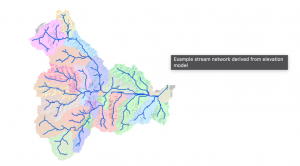
GIS can be used to map streams, identify watershed boundaries, and study drainage patterns. These maps help environmental scientists understand how water moves across a landscape. This information can be useful for water resource management, studying runoff, and identifying areas that may be vulnerable to flooding. GIS tools can also use elevation data to determine how water flows through an area and identify the boundaries of a watershed.

Source: Esri, Hydrologic Analysis Sample Applications.

  1. Deforestation Monitoring

Image: 

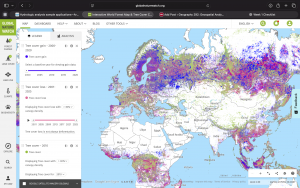
Another application of GIS is monitoring deforestation. By comparing satellite imagery and forest-cover data from different years, researchers can identify where forests have been lost and how land cover has changed. This information can help scientists understand the effects of human activities on ecosystems and support conservation planning. Global Forest Watch is an example of a resource that uses interactive maps and satellite data to help users monitor forest change around the world.

Source: Global Forest Watch, Interactive Forest Monitoring Map.

Conclusion

Overall, this week’s activities helped me review the capabilities of ArcGIS Online and explore how it can be used to share geographic information. Since I already have some GIS experience, I am interested in learning more about the platform’s online tools and how they can be applied to environmental research and real-world projects.