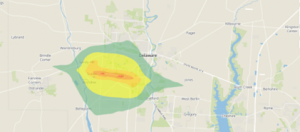
Gregory Week 4

Chapters 5 and 6 from Getting to know Web GIS focus on caching, on-premises Web GIS, and the role of spatiotemporal/real-time data in GIS applications. While these concepts are more technical, they highlight an important shift in how GIS systems manage and deliver large amounts of data efficiently. These chapters emphasize how Web GIS supports dynamic and scalable data processing. Backtracking to the key term caching, particularly with tile layers, which improves performance by storing pre-built map images. Instead of generating maps every time a user interacts with them, cached layers allow for faster loading and smoother user experiences. This is especially important for large datasets or applications with many users. In contrast, on-premises Web GIS (ArcGIS Enterprise) allows organizations to manage their own data and infrastructure, offering greater control over security and customization compared to cloud-based systems like ArcGIS Online.

Chapter 6 introduces real-time GIS and spatiotemporal data, which adds both space and time into analysis. This allows users to track changes as they happen, such as traffic patterns, weather events, or sensor data. The ability to process and visualize real-time information shows how GIS is becoming more predictive and responsive, rather than just descriptive. An application of these ideas using my own data could involve tracking places I visit over time, such as study locations or travel patterns. By incorporating timestamps and location data, I could create a map that shows how my movement changes over days or weeks. Using cached layers would ensure the app runs efficiently, while real-time updates could make the data more interactive and relevant. These chapters also left me with questions about when to use cloud versus on-premises systems, and how to balance performance with data accuracy when working with real-time information.

Gregory Week 3

The readings from Chapters 3 and 4 focus on ArcGIS Experience Builder and ArcGIS Web AppBuilder, both of which expand the capabilities of Web GIS by allowing users to create fully interactive applications. Simply put, these tools take web maps to another level. They provide a framework for designing customizable, user-focused GIS experiences that integrate maps, data, and interactive tools into a single platform. ArcGIS Web AppBuilder emphasizes convenience through prebuilt widgets and templates, allowing users to quickly create functional apps without coding. The art of coding is something I struggle with, so the use of this system is innovative. Beginners are especially being benefitted from this network for projects that need to be completed efficiently. In contrast, ArcGIS Experience Builder offers more flexibility and a modern design approach, allowing users to create more dynamic and visually engaging applications. Its drag-and-drop interface makes it adaptable across devices, which reflects the growing importance of mobile-friendly GIS.

 One of the most important takeaways from these chapters is how user interaction and design play a major role in Web GIS. It is not just about displaying data, but about how users engage with it through tools like filters, search functions, and interactive dashboards. This highlights a shift from simply presenting geographic information to creating meaningful, user-driven experiences. An application of these ideas using my own data could involve creating an interactive map of meaningful locations in my life, such as places I have lived or traveled. Using Experience Builder, I could design an app that allows users to filter locations by category and view images or descriptions tied to each point. This would create a more immersive and organized experience compared to a basic web map. These chapters also raise questions about when to prioritize simplicity versus customization, and how design choices can influence how effectively users interpret geographic data.

Gregory Week 2

The readings from Chapters 1 and 2 focus on introducing Web GIS and how it has evolved into an accessible system for sharing and analyzing geographic data. Simply describing Web GIS as online mapping would be an understatement – the merging of cloud computing, web services, and GIS has completely transformed how spatial information is used. Web GIS allows users to access data from anywhere and create interactive applications without needing advanced programming skills; in other words, it is quite user friendly. One of the most important concepts discussed, in my opinion, is the role of the geospatial cloud. Particularly in ArcGIS Online, this platform allows users to store, manage, and share geographic data through hosted feature layers, which can be created from simple formats like CSV files. These layers act as the foundation for building web maps and apps, which can then be customized with symbology, pop-ups, and attachments such as images or videos. The workflow from data to layer to map to app highlights how interconnected each component of Web GIS is.

Another key takeaway is how Web GIS supports a wide range of applications, from government decision-making to everyday navigation. The shift toward real-time data and mobile access makes GIS more relevant, making it more used than ever before. This also raises questions about data accuracy and management, especially as more users contribute information. An application of these ideas using my own data could involve creating a map of places I have lived or traveled to. By uploading location data and attaching photos, I could build an interactive app using the Attachment Viewer template. This would allow users to explore each location in a structured and visually engaging way, demonstrating how Web GIS can be used not only for analysis, but also for personal experience.

Gregory Week 1

Alyssa Gregory Week 1

Hey everyone! I’m Alyssa Gregory, and I’m looking forward to continuing my experience with GIS in this course. I have already taken GEOG 291, because of which I already have some familiarity with ArcGIS Online and its user interface. This week, I finished the required tasks which included reviewing the syllabus and schedule and completing the training course. Because of my experience in GEOG 291, navigating ArcGIS Online felt somewhat easy and familiar. Also, while looking through my account, I noticed that the My Profile section can be used to organize and present projects in a more discrete and professional way, which seems important beyond just this class and in the workplace too. I also looked at the Training and Help sections, which showed how learning GIS is an ongoing process, with a wide range of resources available depending on how proficient you are. The reading “What Is ArcGIS Online” reintroduced some ideas I had seen before and also helped clarify the bigger picture within those ideas. One key point is that ArcGIS Online is a cloud-based platform, which makes mapping more accessible and flexible compared to traditional GIS software (so many files to download!). Another important note of ArcGIS Online is its focus on sharing and collaboration. This software shows how maps function not just as tools for analysis, but also as a way to communicate information and connect people.

In addition to looking over the website, I completed the ArcGIS Online Basics training course. This course served as a review, while also providing a deeper knowledge of certain features. In the training, I practiced adding and styling layers. These actions showed how presentation of data can influence how it will be interpreted. The course also emphasized that maps are not neutral, and that design choices play a role in shaping understanding (this idea was presented in various sections throughout GEOG 291.

While looking through other ESRI training options, I found a few that seemed especially useful in the future: Spatial Analysis with ArcGIS Online and Getting Started with Mapping and Visualization. These courses seem like they would help build more advanced skills and a stronger understanding of how GIS can be applied. Exploring GIS applications through Google and Google Scholar showed how widely this technology is used in different fields.

Noise pollution mapping uses GIS to measure and put numbers into visual images. The mapping data will include variation in sound levels throughout different areas. This will be especially clear in cities with heavy traffic or even just a high-density population. These maps help identify high-noise zones and guide decisions like adding sound barriers or planning where to construct roads.  Source: Slabbekoorn, H. (2019). Noise pollution. Current Biology,29(19), R957–R960. https://doi.org/10.1016/j.cub.2019.07.018


Indoor GIS focuses on mapping spaces inside buildings like airports, hospitals, and malls, where GPS and the internet doesn’t work well. This helps with navigation and emergency response services. This is done by using detailed floor plans and spatial data.  Source: Li, Y., Kong, N. N., & Hum, K. (2021). Indoor GIS Solution for Space Use Assessment. Papers in Applied Geography, 7(1), 104–116. https://doi.org/10.1080/23754931.2020.1843526