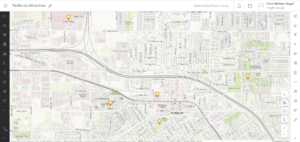
Or is it technically week 2? I don’t know but I’m gonna call it week 3 for simplicity. Chapters one and two are fairly interesting but also very confusing. Chapter 1 introduces the basic aspects of Web GIS, such as the ‘cloud’ for data sharing and storage, the evolution of the software (can I even call it software if its all online?), types of users, content, and apps. Now I thought 291 was painfully technical in its explanation of things but I’ll say this for the record; 292 and Web GIS takes the technical aspects of 291 and cranks it up to 100. Half the things the chapter tries to explain go directly over my head and therefore my feeble little brain fails to comprehend any of what is said. The book content tutorials are similar to the ArcGIS program at least. For the 1.3 tutorial there was no ‘community map’ as asked by the steps in the tutorial. Everything else went smoothly until attempting to create the app with which I was met with a blank screen that didn’t load a preview even after 10 minutes so not sure what’s going on there.
Chapter 2 discusses web apps further and going more into different features such as ‘feature layers’ which allow you to style and customize them in a way that fits your needs and can be used to create a ‘story’. For example, different types of ‘smart mapping’ are shown which can be utilized. The chapter also discusses the ArcGIS Atlas which if I recall correctly was used briefly in 291 but I may be mistaken. Overall the chapter discusses ‘storytelling’ which now that I think about it seems odd to discuss in this setting but I digress. In tutorial 2.3, working the attribute expressions didn’t work either as the book asked me to input a code yet there were no options to do what it was asking me to do. I have the 5th edition book so I don’t know why things aren’t working… I’ll need to sort that out next week as I can’t complete the work like this if I just keep hitting dead ends halfway through the tutorials.
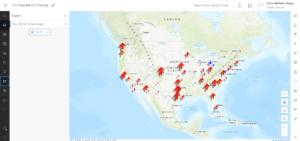
An idea for a map utilizing information from chapters 1 and 2 and also using data from 291, an interactive app could be developed towards those engaging in recreational activities involving water (boating, fishing, swimming, etc) that displays the sources and spread of things such as pollution and algal or bacterial blooms using data published by whatever local government organization publishes data on said factors. This could warn water-goers of these areas and focus cleanup efforts on said areas.