Chapter 7: 3D Web Scenes
A web scene is just another name for a 3D map. They can be used in fields from construction, to engineering, to urban planning, in which I am particularly interested. (ArcGIS Urban is the service that combines GIS with urban planning. It can cover any development from short, year-long projects, to decades-long plans.) Some of the features of web scenes are pretty remarkable, such as x-ray vision and shadow analysis. Shadow analysis could be useful for reducing heating or cooling costs in a building by planning the best spots for windows to let sunlight in in the winter, but potentially find more shade in the summer.
Because of the added dimension, scenes are more elaborate than 2D maps. They are composed of four elements: surfaces (topographic basemaps that can include plants and buildings, or just the bare ground), features (just like a 2D map), textures (using imagery or symbols), and atmospheric effects like light or weather. Also, 3D object scene layers are simpler ways to visualize an object in 3D, kind of like a generated sketch. The photo in the chapter definitely reminds me of a comic book! Speaking of comic books and art in general, I think the use of GIS in filmmaking and CGI, like for generating city buildings, is fascinating. It seems to add a very realistic touch. On another note, the scope of indoor views is also really impressive. Using GIS to map pipes in a building would not be my first thought for an application, but it seems like it would certainly be useful.
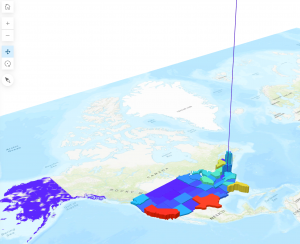
Figure 5.1: Population density in the United States. This is a really cool perspective for how dense Washington, DC is (because it is a city) compared to any other state. Also, some portions of Alaska have higher elevations than average population density, which is why the whole state is not covered.
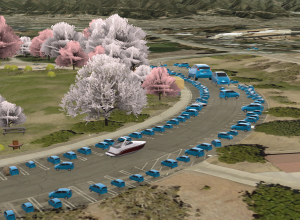
Figure 5.2: a Ford Fiesta fiesta!
Potential Application:
I thought the map of US population density from this chapter was one of the most interesting yet simple applications from this course. To combine my interests in urban planning and public health with GIS, I could measure a different feature and its density by state or by county within a state. For example, I could create a map in the Appalachian region (including states like Ohio, Kentucky, and West Virginia) displaying grocery store density. Areas with low grocery store density might be considered “food deserts,” giving insight into which areas might require the most help and attention from the government or other aid organizations.