Chapter 7:
This chapter is about 3D web maps, the advantages of using this type of mapping and its features in GIS. It adds extra dimension, is easier to interpret than 2D, allows designers to build flexible scenarios quickly and effectively, offers powerful analytical functions, etc. A web scene can also contain multiple layers which is helpful in features, map image, raster, vector tile, and scene layers. There is a group called photorealistic scene that aims to re-create reality using photos to texture features. In a cartographic scene, it takes 2D thematic mapping techniques and moves them into 3D. The four main elements to a scene include surfaces. features, textures, and atmospheric effects: all of which add depth and context to the map. There’s also 3D object scene layers, which I was most excited to learn about, which are features used to represent and visualize 3D objects. They can be created manually or automatically using procedural rules. It also goes over some new technology that is only available in 3D: VR, XR, and the metaverse. The advantage of this is great for immersing users in GIS, for example, ArcGIS 360 VR is a web app that allows you to view 360 VR experiences (3VRs) on desktop PCs, mobile devices, and VR headsets.
Tutorial 7 :
I ran into a little trouble at the start with ArcGIS online with the scene option. For these tutorials, it requires you to be in the “scene” tab for ArcGIS online, but my browser (Microsoft Edge) had the hardware acceleration disabled, and I had to go into my settings and turn on the “hardware acceleration” toggle button so it could show 3D images.
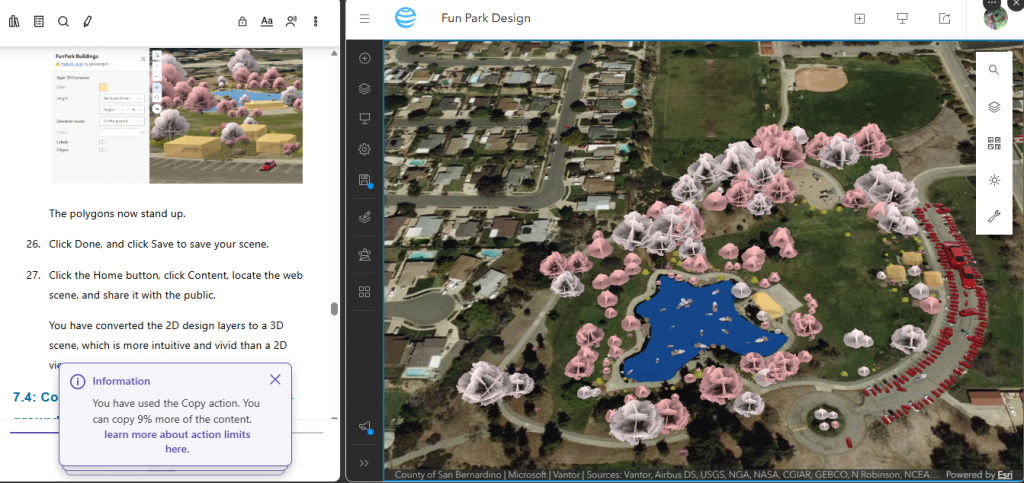
I had a ton of fun figuring out how to do all of these 3D scenes and changing their shapes/colors! 7.1 and 7.2 were easy enough, it was cool to see how high the population density of DC was in 2020 (it was spiked really high lol). I liked 7.4 and 7.5 the most! Seeing the park come together was so cool, and I loved messing around with all the 3D objects and choosing different colors for the trees or picking different cars out. Also, for 7.5 it was super fun to be able to go underground and see a bunch of point of views!
Assign: Select one of your four ideas (Chapters 5-7) and create it.
I could use this section on 3D scenes to represent and visualize green canopy and how it effects urban heat island effects. Using 3D tree models to show how the temperatures in urban areas. I can map an area and use the 3D vegetation symbology (oaks, maples, palms) and put them in my web scene. Using the daylight widget, i can show the trees cast shadows on buildings and sidewalks at different times of day, showing their cooling effect visually. This could be done in any location, including Delaware around the city. This could be expanded into showing where different building’s postions in the city also effect shadows and the warming of the areas around it.