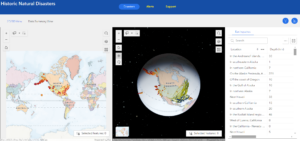
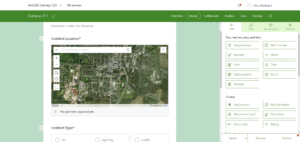
Chapter 3 introduces the ‘Experience Builder’, an ArcGIS component that allows for app to be configured with more functionality than what is typical, such as dynamic content, charting, and reporting. Chapter 3 also introduces the various terminology of the Experience Builder component. The chapter also explains the workflow for creating web apps with the Experience Builder, and how to understand widgets and their contents. Chapter 3 also explains how to configure widgets and use things such as filtering. Finally Chapter 3 discusses ‘triggers’ and ‘actions’, and how to utilize them. The Experience Builder is a multi-step process which starts by using a template or by starting from scratch. From using the Experience Builder maps can be made in 2D or 3D, and allow you to configure the various widgets, themes, layouts, and presets. The tutorial went smoother than the ones in chapter 1 and 2, but it was still a bit difficult and technical and took a while to complete. That being said, I love learning about natural disasters so this is right up my alley. Also at least this one worked and despite it being a bit difficult it did ultimately end being a little bit fun.

Chapter 4 introduces a mobile version of GIS software, the approaches to building mobile apps. collecting data, and the configuration of feature layers. I have never been a particular fan of mobile apps, something you can thank the constant spam of mobile app ads for. However, I see how mobile applications of GIS could be utilized to an advantage. A mobile system also potentially allows for more people to access the software and make data collection easier. The features listed are also compatible with numerous different operating systems, and with ArcGIS only being operable on Microsoft and Windows systems, collaboration and the sharing of data becomes easier. As for the tutorial, it had some of the same problems as tutorials 1 and 2, with serious mismatches between the book and website that made completion of 4.1 and 4.2 impossible as once again the option to add an expression was not there, or rather it was there but the options the book instructed me to select were not. The majority of 4.3 was doable until it asked to me to find a ‘change style’ button which could not be found. With 4.4 being a follow up to 4.3, this made it impossible to proceed with that as well. I was apprehensive with 4.5 as I’ve never been a fan of downloading apps onto my phone for academic reasons as it always signs me up to some email newsletter. In addition my app store account is linked to my fathers email which I don’t have the password for so I was unable to download the app to begin with. I had the same problem with 4.7 and 4.9 being unable to access the app store and with it being late in the evening I was unable to contact my father. 4.6 was also broken as I was unable to uncheck a ‘only search in your organization’ button and this part of the tutorial relied on data that would’ve been created with 4.3 and 4.4 but because those could not be completed, I was also stuck here. 4.8 had the same issue and 4.6 with no option to uncheck the ability to only search within the organization and multiple results turning up when I input what the book asks me to search. In short, while the reading portion of Chapter 4 was interesting, the tutorial was a nightmare to sit through and try to go back through things to see what I missed. Dr Krygier if you see this, I don’t know what you can do about this, but these books are somehow severely out of date already. At the very least parts of it were doable compared to tutorials 1 and 2 which effectively blocked me from the start.

Application Idea: Attempting to go off something I enjoy and using what information I was able to learn in Chapters 3 and 4, as an avid angler, it might be an interesting idea to create a 2D/3D map using a hydrology dataset which shows various fishing locations on bodies of water in a given location, such as within Delaware County. This application could not only give a better view of the area from both a 2D and 3D perspective, and then customized to show what species can be caught in x location and if said location has a history behind it. For example, a 2D/3D view of a spillway beneath a major dam, what species can be caught in the spillway, and the history of the dam itself.
Data Inventory: The instructions say to include it in the posting so not sure if this will transfer over correctly. If it does, fellow students, I apologize for the wall of text. Not sure how else I’m supposed to turn this in.
- Delaware County E911 Data: Contains all certified addresses within the county. Supports emergency services and geocoding. Updated daily and published monthly.
- Township: Shows different townships in Delaware county. Updated on a need-as basis and published monthly.
- PLSS: Shows all Public Land Survey System polygons in military districts. Shows boundaries between PLSS systems. Updated on a need-as basis and published monthly.
- Dedicated ROW: Consists of a map of roadways designated ‘right of way’ within Delaware County. Updated on an as needed basis and published monthly
- Zip Code: Shows all ZIP codes in Delaware county based on a 2003 census. Updated on an as needed basis and published monthly
- School District: Shows all school districts in Delaware county based on parcel records. Updated on an as needed basis and published monthly.
- Street Centerline: Depicts the center of the pavement of public and private roads within Delaware County. The data is intended to support appraisal mapping, 911 emergency response, accident reporting, geocoding, disaster management, and roadway inventory. Layers are updated daily but 3D fields are updated annually
- Recorded Document: Dataset consists of points that represent recorded documents in the Delaware County Records. Documents include vacations, subdivisions, centerline surveys, surveys, annexations, and other miscellaneous items. The dataset was created to facilitate the process of locating miscellaneous documents within Delaware County. The dataset is updated on a weekly basis and is published monthly.
- MSAG: MSAG (Master Street Address Guide) is a featureset of the 28 different political jurisdictions that make up Delaware County. created to ease the process of locating the boundaries between cities and towns. The data is updated on an as-needed basis and is published monthly.
- Survey: Shows points of land surveys with Delaware County. Most of the data was recorded before 2004 but is still being updated on a daily basis and is published monthly.
- GPS: Identifies GPS points as established in 1991 and 1997. Published monthly and updated on an as needed basis.
- Parcel: Shows all polygons that represent cadastral parcel lines within Delaware County. This data is maintained by the Delaware County Auditor’s Office. The data is maintained on a daily basis and is published monthly.
- Tax District: This set of data consists of all tax districts within Delaware County. The data is defined by the Delaware County Auditor’s Office. The data is updated on an as needed basis and is published monthly.
- Subdivision: Shows all subdivisions in Delaware County. The data is updated daily and published monthly.
- Precinct: Shows all of the Voting Precincts within Delaware County. The data is maintained by the Delaware County Auditor’s Office. The data is updated on an as needed basis and is published as needed by the Delaware County Board of Elections.
- Annexation: Data contains Delaware County’s annexations and conforming boundaries from 1853 to present year. The data is updated on an as-needed basis and is published monthly.
- Municipality: Shows all municipalities within Delaware County.
- Building Outline 2021: The data here consists of building outlines for all structures in Delaware County, Ohio as of 2021. Updated on an as needed basis.
- Address Point: Shows the data from the Location Based Response System (LBRS) and shows all addresses in Delaware County. The data is intended to support appraisal mapping, 911 Emergency Response, accident reporting, geocoding, and disaster management. The data is updated on a daily basis, and is published monthly.
- Condo: Dataset consists of polygons representing condominiums in Delaware County that have been recorded by the Delaware County’s Recorder’s Office.
- Farm Lot: The data here consists of all the farm lots in both the US Military and the Virginia Military Survey Districts of Delaware County. created to facilitate in identifying all of the farm lots and their boundaries in Delaware County. The data is maintained on an as needed basis.
- Original Township: This data consists of the original boundaries of the townships in Delaware County, Ohio before tax district changes affected their shapes.
- Hydrology: Shows all major waterways in Delaware County.
- ROW: Consists of all lines designated as right of way.
- Delaware County Contours: Shows the contours of the terrain in Delaware County.