Update 7/19/2021
100 points
Assign: Monday, October 17
Due: Wednesday, November 7
Classifying and Mapping Your Data
It might seem a bit odd that halfway through the semester, we are just getting to actual maps of your data. That’s about right: half the time for a mapping project is typically spent getting the data ready to map. Huh!
You have cleaned up your historical Census data and brought it into ArcGIS, where you have linked it to a base map of your state (or states). You also spent a crapload of time futzing with the formatting of the data to allow it to be animated. In essence: using a map that changes over time to show data that changes over time.
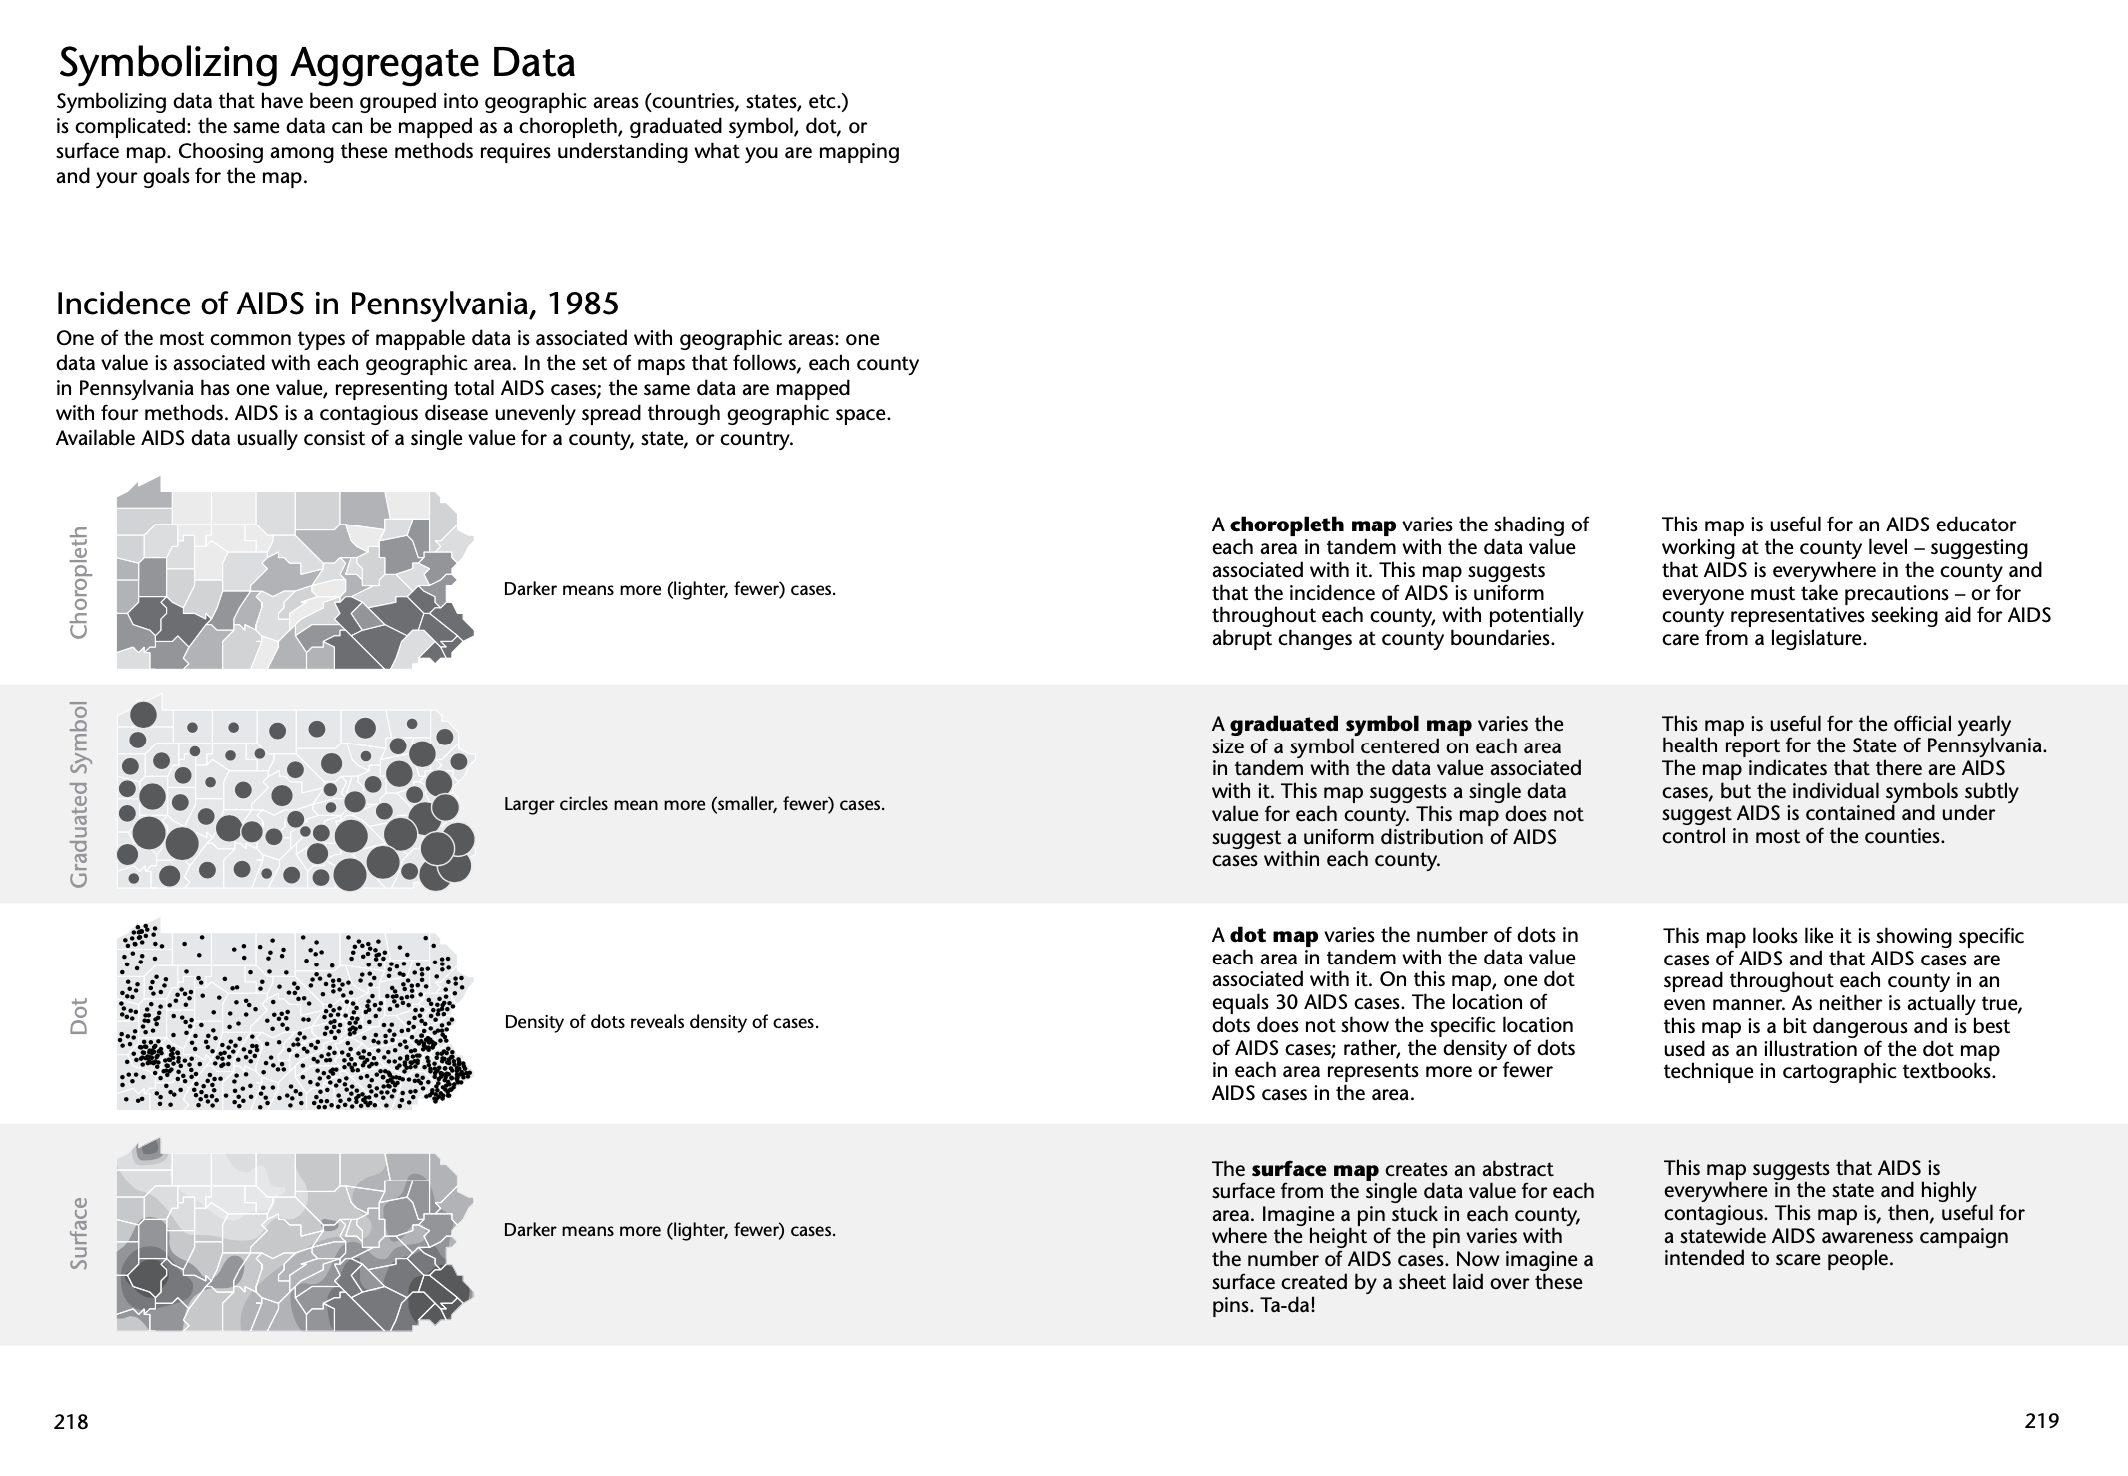
You will map your historical population data as
- a choropleth (graduated color) map
- a graduated symbol map
- a dot density map
Making Maps (pp. 218-219) brilliantly explains the differences between these different ways of mapping the same data:
You will have to make data classification and symbolization decisions for these maps:
- a choropleth (graduated color) map
- have to classify data: Making Maps, pp. 173-181
- symbolization issues: Making Maps, pp. 220-221)
- a graduated symbol map
- have to classify data: Making Maps, pp. 173-181
- symbolization issues: Making Maps, pp. 2220-223
- a dot density map
- don’t have to classify data
- symbolization issues: Making Maps, pp. 226-227
Ultimately you need to think about how the map type, classification, and symbolization decisions affect the understanding of the data being mapped. Same data, different map design choices, different looking maps, different interpretations? I’ll have you reflect on this once you complete the maps.
The Details
This lab requires you to have completed Lab 5, and have an ArcGIS Pro Project for your state with all steps in Lab 5 completed. Please make sure your instructor has reviewed your work for Lab 5.
I’m also going to get a bit less specific in my instructions, as you should be getting a better feel for how ArcGIS Pro works. It’s also good for you to have to figure out how to figure out how to do things with ArcGIS Pro. Give it the Old College Try.
Start by duplicating the layer you created in Lab 5: mine is called Wisconsin_Counties
Copy and Paste three layers and rename them thus (substitute your state name)
- Wisconsin_Choropleth
- Wisconsin_GraduatedSymbol
- Wisconsin_DotDensity
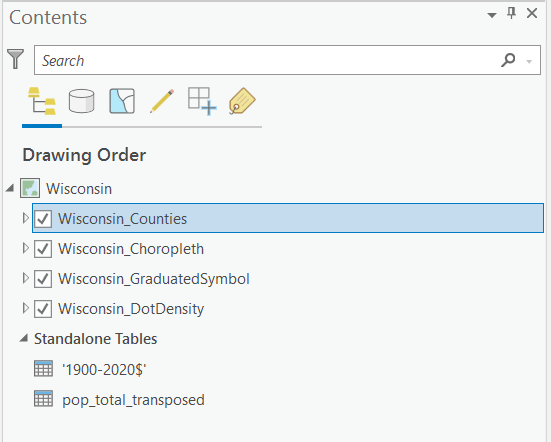
Uncheck the original Wisconsin_Counties (it’s a backup layer)
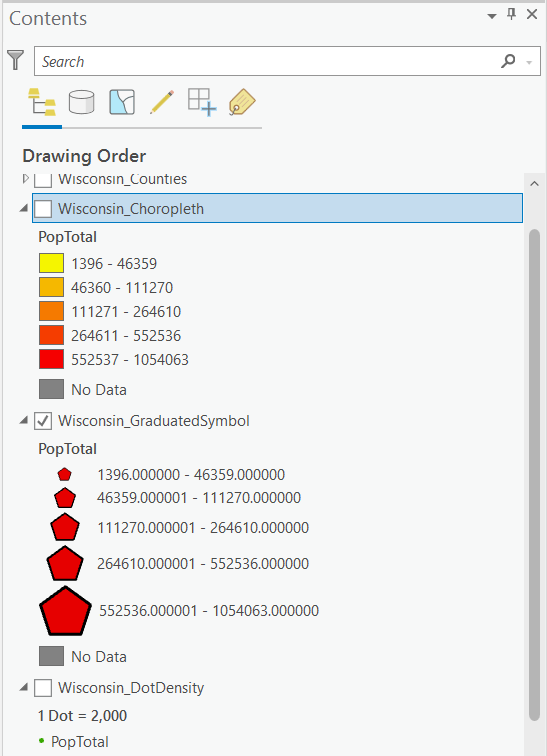
Wisconsin_Choropleth is already set up as a choropleth (graduated color) map. Uncheck the layer to make it invisible and hide the legend.
Check Wisconsin_GraduatedSymbol and right-click on the layer and select Symbology
- change the primary symbology to graduated symbols
- way up top, under Map and Time click the Play all Steps (Play) button to animate
- futz with the symbols a bit: change the minimum size to 8pt. and max. to 50pts
- play the animation again: more dramatic!
- click on the circle symbol next to Template and change the circle to some other symbol
- also change the background
- notice that you have to add a “No Data” class (remember? Lab 5?)
- Save
- You’ll come back and carefully modify the classification and other symbolization options for this map type later. But you get how to make the changes.
Uncheck Wisconsin_GraduatedSymbol and hide its legend in the Contents
Check Wisconsin_DotDensity and show its legend in the Contents.
- change the primary symbology to dot density
- way up top, under Map and Time click the Play all Steps (Play) button to animate
- futz with the symbols a bit: click on the single dot symbol (under Symbol, in the table under the color bar) then Properties and change Color to something else; then Apply
- change the Dot Size to 3pt
- play the animation again
- change the background to some other color and Apply
- On the “no data” counties (if you have any): for this map type, the counties with no data will have no dots, which is ok. There is a way to exclude these counties if you want to try and find it.
- Save
- You’ll come back and carefully modify the classification and other symbolization options for this map type later. But you get how to make the changes.
Make Your Maps using Making Maps as a Guide
You can now review the pages below in Making Maps (we’ll also go over them in class) and make symbolization decisions about your maps. For your lab log, list specific guidelines from Making Maps for each of the map types (see below), list your design choice, and why you made it. Obviously, make the changes in your ArcGIS Pro project.
- a choropleth (graduated color) map
- data classification choices: Making Maps, pp. 173-181
- symbolization choices: Making Maps, pp. 220-221)
- a graduated symbol map
- data classification choices:Making Maps, pp. 173-181
- symbolization choices: Making Maps, pp. 2220-223
- a dot density map
- don’t have to classify data
- symbolization choices: Making Maps, pp. 226-227
Your instructor is happy to provide feedback along the way.
Completing the Lab
Email me the link to your blog entry for Lab 7. The blog entry should include the following, illustrated with delightful Snipping Tool illustrations from your Project.
- a choropleth (graduated color) map
- data classification choices: Making Maps, pp. 173-181
- symbolization choices: Making Maps, pp. 220-221)
- a graduated symbol map
- data classification choices: Making Maps, pp. 173-181
- symbolization choices: Making Maps, pp. 2220-223
- a dot density map
- don’t have to classify data
- symbolization choices: Making Maps, pp. 226-227
Finally: revisit your three maps (choropleth, symbol, dot) and think about the question at the start of this lab: Think about how the map type, classification, and symbolization decisions affect the understanding of the data being mapped. Same data, different map design choices, different looking maps, different interpretations? Jot down a few thoughts in your lab log. I’ll ask you the question again in the final evaluation (Lab 10).