Update 6/11/2022
100 points
Assign: Wednesday, Sept. 21
Due: Monday, Sept. 26
Mappable Data
Mappable data is not truly mappable until you get it in a format your mapping software (in this case, ArcGIS Pro) is happy with. You must do what software wants!
Thinking ahead is vital. We are going to create an animation of our time-series population data (population and population change from 1900-2020). That means the data we downloaded must be
- combined in one Excel file (which can be imported into ArcGIS Pro).
- have the data organized, in that file, in a manner that will allow us to animate the data.
- total population data (from the Census data), each decade 1900-2020
- percent population change (derived data), 1900-1910, 1910-1920, etc.
In the next lab (4), we’ll learn the basics of ArcGIS Pro and ArcGIS Online. In Lab 5 we’ll do even more data organization, in ArcGIS Pro, to allow us to animate our data. Lab 6 will focus on data classification and symbolization.
Futzing around with data typically takes a lot of time in any mapping & GIS Project. This one has a shitload.
The Details
The instructions below assume you are working on a Windows computer and using Excel. You can actually do this lab on a Mac but the commands are a bit different.
Data processing is exacting, picky, inflexible, and requires you to pay attention to a level of detail usually unknown to humankind. Focus and gird yourself!
Make sure you have all your census data and in the correct format. Secret details on where to find this data are here. My project includes:
- Two files for the 1900 – 1990 decennial census population data (files include all 50 states data)
- 1900-90.txt
- cencounts.csv
- One file for the 2000 -2010 decennial census population data (file is specific to my state, Wisconsin)
- co-est00int-01-55.xls
- One file for the 2020 census population data (file is specific to my state, Wisconsin)
- mine is co-est2021-pop-55.xlsx
Please look up what the above three different file extensions (.txt, .csv, .xls) mean (in other words, what file types are they and what are their characteristics) and include them in your lab log entry for this lab.
Open Microsoft Excel. Select Open Other Workbooks (lower left) then Browse to your 1900-90 population data file (1900-90.txt). Select All Files to see your .txt file.
Open your file. A wizard window should pop up. Wizrd! This is a tool for turning a simple text file into an Excel file. Neat. Store that away in your brain for the future.
- Original data type is Fixed Width (select if you need to, but you shouldn’t), then hit next.
- Set field widths (add column breaks): click and drag the location of the breaks (vertical lines). You can click and add breaks or click and drag off the “Data preview” to delete breaks. Shoot for the break right up against the right side of all the numbers in a column. Make sure you don’t lop off any numbers! That would be bad. Scroll up and down in the “Data preview” to make sure everything looks ok. Hit next.
- Next window: column data format should be general…then hit finish.
Look at your data in Excel. Holy haunch of Helmetshrike!
The data looks… well, like a bit of crap. What are the implications of free data from the WWW? Converting data is often a messy but exacting process. Halp us holy St. Isidore of Seville!
- Save in Excel: File >> Save As >> Browse (to your Data folder). Save as Excel Workbook (.xlsx): 1900-90.xlsx
- why Save As?
This data will take a bit of cleaning up!
Always be careful when cutting / pasting / adjusting. Turn your brain on please.
- Remove the rows of jibberish above the FIPS and year row.
- Remove the total US population row, and the total state population row (we won’t need this data for our project).
- Remove the state abbreviation data
- FIPS column: this is a unique identifier code for each geographic area (in this case, counties) in the US and World. For the US, the first two digits are the state, the last three digits the county. Please look up information about FIPS codes and why they are important for GIS. Comment on what you find in your lab blog.
- Notice that numbers are justified right and text justified left in Excel. Guess what? When we go into ArcGIS Pro the software wants our FIPS codes to be text and not numbers! So we have to force the numbers to text.
- ArcGIS Pro assumes FIPS codes for states have five digits. If you have four (Alabama through Connecticut) you will have to add a zero before each of the FIPS codes. FYI, 01 is the same as 1. Problem is, if you add a zero before a number in Excel it will just disappear. Aghrgh.
- Lettuce slay these two ducks with one sandwich: click on the first FIPS code (ending 001)
- If you have Alabama through Connecticut, type a single quote and the number 0 then enter.
- All other states, type a single quote and enter.
- Notice that the FIPS code has 5 digits and is left justified and has a wee green triangle in the corner. That means it’s a number stored as text!
- Do this for the rest of your FIPS codes
- There is a shortcut for doing all of these at once! See if you can figure it out.
- Add the word County in the column above the county names
- Replace any cell with — with an empty cell
- what does “—” mean?
- Delete the data for every other state but yours, and Save As a new file: mine is wisconsin-1900-1990.xlsx
- Find all instances of the word County (with a single space before it) and replace all with nothing
- Cut and paste the County column so it is just after FIPS
- this follows the convention for county naming in ArcGIS Pro
- Save the file
You should have a file that looks like the image below.
Update our file with the 2000, 2010, and 2020 data
Add three more columns: 2020, 2010, 2000:
Open the file of 2000 and 2010 data, which should be specific to your state: mine, for Wisconsin, is co-est00int-01-55.xls
- Look at the data: you should see that it is formatted a bit differently, and does not include the FIPS numbers. But it does have the county names in alphanoodicle order.
- There are also more columns of data than we need. Only copy the columns we need and paste into the file we have been working on (mine is wisconsin-1900-1990.xlsx)
- Use the April 1, 2000 column. Copy only the County data (not the total population for your state)
- I’m copying the column from Adams to Wood (click on Adams, shift-click on Wood)
- right mouse click and copy
- Then go to your Excel file with the new empty column for Y2000 and click in the first cell
- right mouse click, and under Paste Options match destination formatting
- scroll down to make sure it looks right! Check that big and small population counties match the earlier data, and that there are the same number of rows of numbers
- Repeat for April 1, 2010
Save As a new file: mine would be wisconsin-1900-2020.xlsx
- Open your 2020 population file (mine is co-est2021-pop-55.xlsx) in Excel
- check that the counties are in alphabetical order
- copy the April 1, 2020 Estimates Base column
- paste in the file with all your other data.
- Save your work
If there are commas in any of your population data, get rid of them.
- select the columns with the commas and then right-mouse click and select Format Cells
- under Category click on Number
- make sure “Use 1000 Separator (,)” is not checked
- set Decimal Places to 0 (zero) and hit OK
- Save your file.
Change the sheet name (tab at bottom) to 1900-2020 (right mouse click on it) reflecting the new range of data.
Delete the FIPS column: Typically FIPS is safer than words (like County names) but in this case, the county names work better.
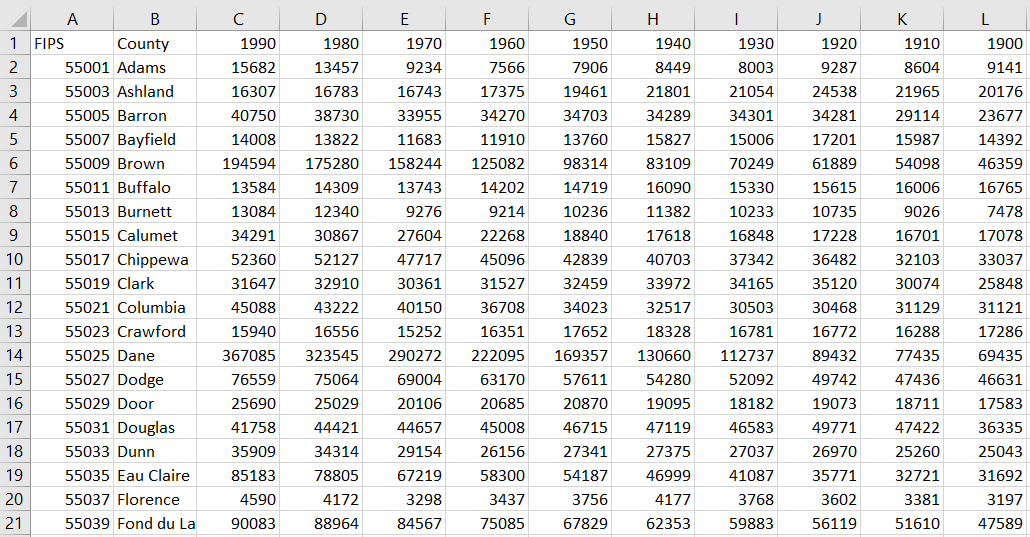
My file for my state is below. Your file should look similar.
![]()
Transposition
Turns out that having the years along the top and counties along the side of the Excel file is not correct for what ArcGIS Pro initially wants. Thus, we will transpose the rows and columns.
In your file with all your data, click once on the upper left cell (County) and then shift-click on the farthest bottom and right cell (selecting all your data, but only your data).
Right-mouse click once on the selected data and copy.
Scroll down and click on an empty cell, about 5 cells down in the FIPS column.
Right-mouse click, then Paste Special and check the transpose checkbox and hit OK
Mine looks like this:
![]()
Delete the data above the transposed data.
Careful! Click once on the first row then shift click on the last empty row right above your transposed data. Right click on the selected data and delete.
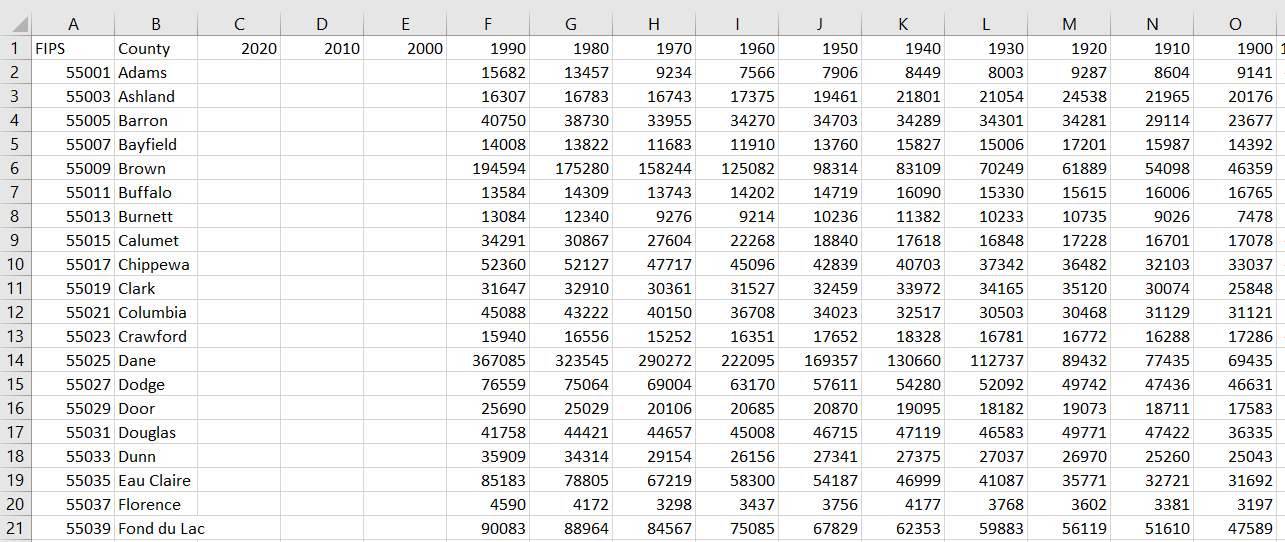
Check that you have all your County columns. This is mine (at least up to Door County)
![]()
Save as… and rename: mine is wisconsin-1900-2020_transpose.xlsx
Change County to Year (the column header over the years) and Save.
Thus this:
![]()
What a crap-load of work!
This is all contingent on knowing what will allow us to some fancy animations in ArcGIS Pro. I’m telling you how to do it, but it took me a crap load of time and experimentation to get the data correct. In a different situation, you will have to experiment to figure out how to prepare your data so it works in ArcGIS Pro or some other GIS software. It’s no small feat!
Tidy up your Data Folder
- In your Data folder, create a new folder called Original Data
- Move everything but your two final .xlsx files (mine are wisconsin-1900-2020_transpose_total.xlsx and wisconsin-1900-2020_transpose_change.xlsx) into the original data folder
Yeesh! Jot down a few inspired paragraphs about the joy of processing data for such mapping projects in your digital lab blog.
Time to celebrate!

Completing the Lab
By end of class on the due date:
Email me a copy of the Excel file with your combined Census population and % change data (1900-2020)
Email me the link to your blog entry for Lab 3. This should include
- Definition of three different file extensions (.txt, .csv, .xls)
- Comments on FIPS codes
- Comments on processing data
- Any problems with this lab, and solutions to the problems
Extra Steps – Not Required Fall of 2022!
Calculate Population Change in Excel
Population change data (from 1900-1910, 1910-1920) is better for visualizing using graduated symbol (or choropleth) maps. More on that later.
It’s actually easier to calculate population change data in ArcGIS Pro. Alas, the way Pro likes data to be organized for animations makes such calculations impossible.
We will instead use functions in Excel. A useful skill, this in essence allows you to build an equation in a cell or cells that calculates a new number. I can add up your scores for Geog 112, for example, and divide by the total number of points and multiply by 100 to get your % grade in the course.
If you thought the last section was tedious, it gets worse. Again: brain on.
This is the step where you can easily create plausible bullshit data.
Excel functions are picky and easy to mess up. Thus, heads up.
Add new column headers, after your existing total population data, for your population change data: 19001910 then 19101920 then 19201930 and so on to 20102020
Notice that there is no dash or underline, just numbers: it has to be this way to work properly in ArcGIS Pro.
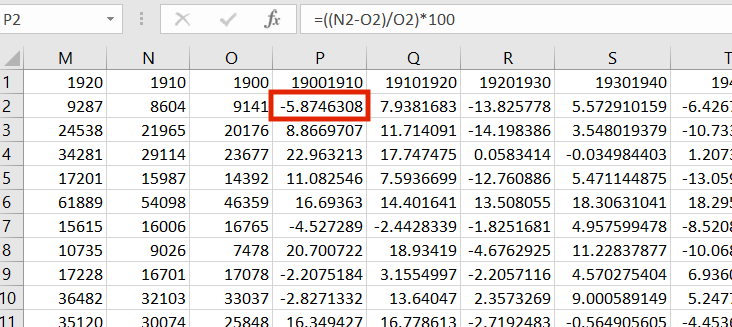
Excel functions apply to a cell (or cells). The highlighting in Excel will look different than below, but in essence to calculate the % change from 1900-1910 use the function =((N2-O2)/O2)*100
make the value of the cell = to ((1910-1900)/1900)*100
or, newest year minus the oldest year divided by the oldest year and times 100
N2 is the total population in this county for 1910 (newest year)
O2 is the total population cell in this county for 1900 (oldest year)
What would the equation for 1910-1920 be?
=((M2-N2)/N2)*100
and so on…
The red cell is the population change in this county in Wisconsin (Adams) between 1900 and 1910. It dropped nearly 6 percent, thus the negative value. Population change can be either negative or positive.
You can see the function in the function window above.
I’ll demo this in class as it’s difficult to capture the highlights (which are set differently on different computers).
Move slowly and methodically. Crazed clicking and selecting can easily screw up the functions and apply them to cells you don’t want them applied to. Stick to the following routine carefully.
The basic routine is thus:
- click once in the cell below your 19001910 column
- in the function window type =((N2-O2)/O2)*100
- this should highlight (with corresponding colors) the correct years (1900 and 1910)
- if not, stop!
- Enter
- the percent change for that county and that pair of years should appear.
- if not already selected, click once on your first calculation cell.
- carefully click on the tiny box in the lower right corner of the cell and drag straight down to the end of your data (not beyond) then release
- this should apply the function to each of the subsequent counties
- review the numbers:
- by hand (or using a calculator) check that the calculated data is correct for the first and last cell
- newest year minus the oldest year divided by the oldest year and times 100
- please do this for each first and last cell in the rest of the columns!
- Save
- if good, continue with the next column
- click once on the column header for 19101920
- click once on the first cell under 19101920
- copy the equation from here – not the function window!
- =((N2-O2)/O2)*100
- in caps, carefully change the function for 19101920: N to M and O to N
- check that the appropriate cells are highlighted
- Enter
- Save
- then repeat the process of clicking and dragging down your column to calculate percent change for all the counties in your state between 1910 and 1920.
- check that the first and last cells in the column are correct with a quick hand calculation.
Repeat for each column.
Save after each column is calculated.
Slow and methodical.
This is one of the most important steps to not make mistakes, moving quickly and not double checking your functions can lead to major screwups. This seems (is!) tedious, but it’s vital for accurate data.
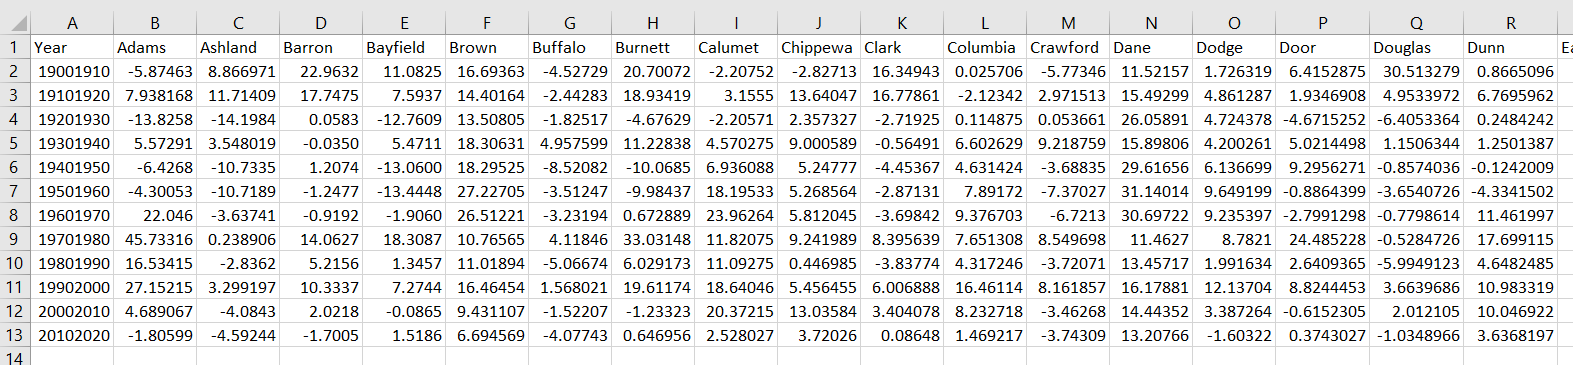
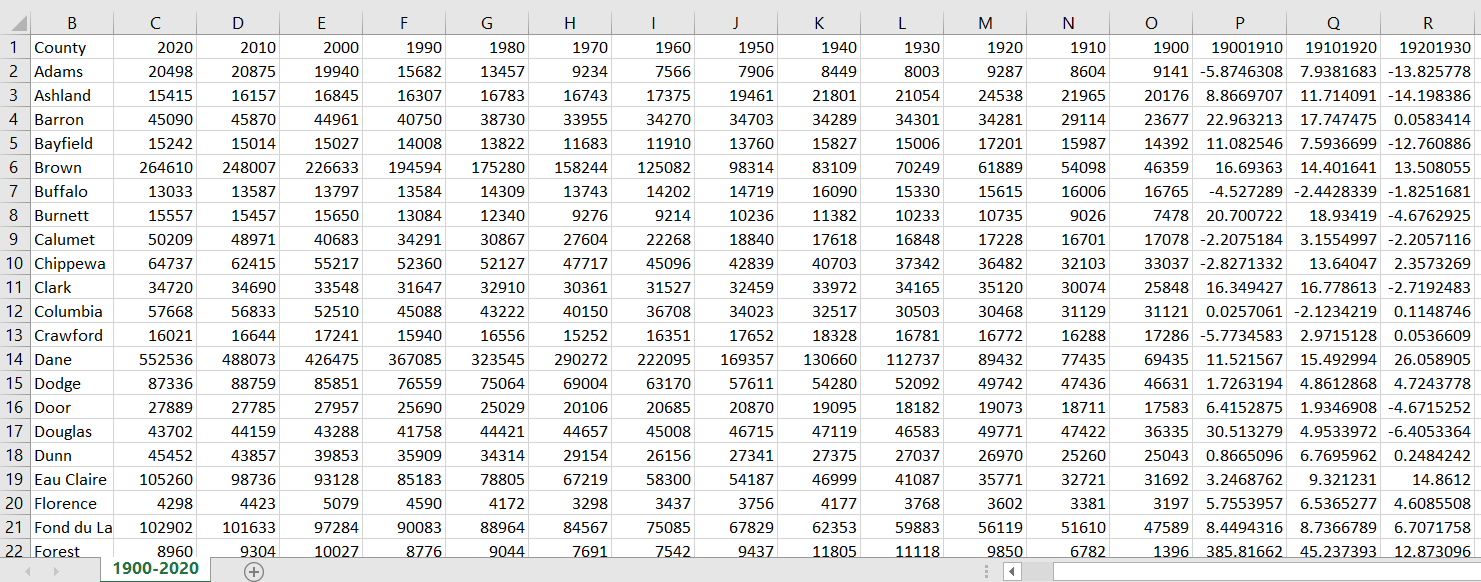
Part of my file with the percent change calculations:
Transposition (both total and change data)
Turns out that having the years along the top and counties along the side of the Excel file is not correct for what ArcGIS Pro initially wants. Thus, we will transpose the rows and columns.
In your file with all your data, click once on the upper left cell (FIPS) and then shift-click on the farthest bottom and right cell (selecting all your data, but only your data).
Right-mouse click once on the selected data and copy.
Scroll down and click on an empty cell, about 5 cells down in the FIPS column.
Right-mouse click, then Paste Special and check the transpose checkbox and hit OK
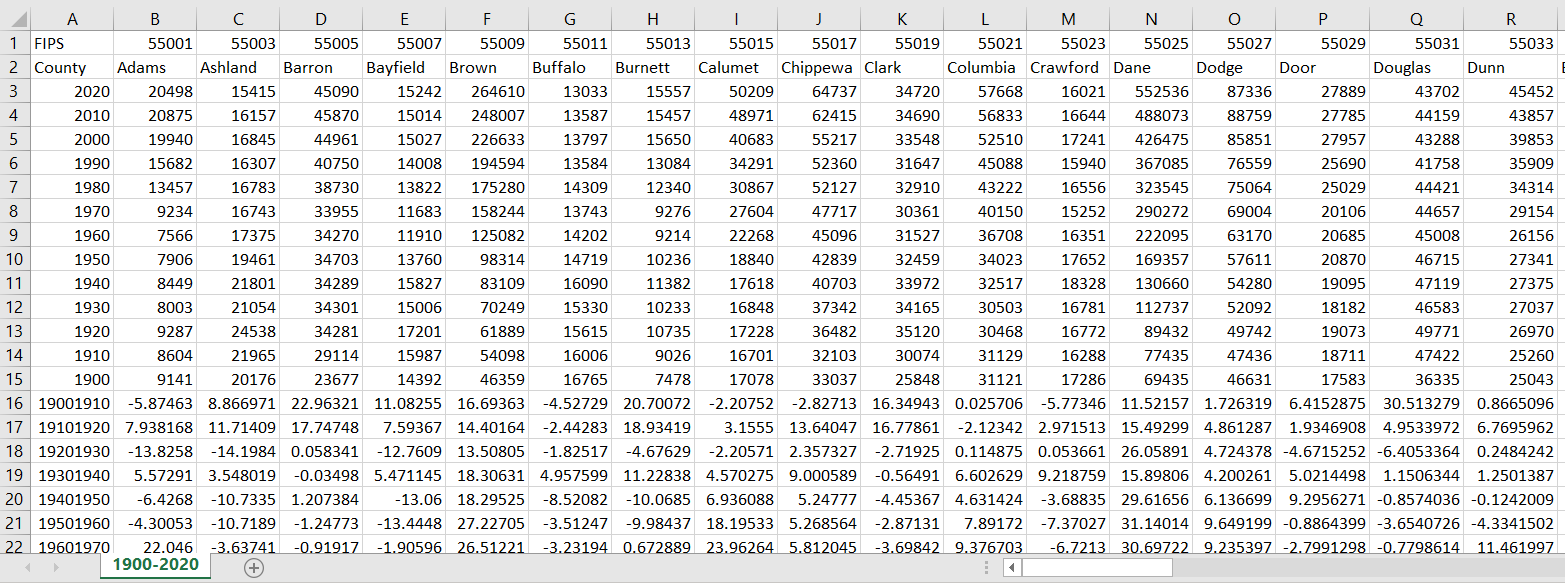
Mine looks like this:
![]()
Delete the data above the transposed data.
Careful! Click once on the first row then shift click on the last empty row right above your transposed data. Right mouse click on the selected data and delete.
Check that you have all your FIPS and County columns. This is mine:
Save as… and rename: mine is wisconsin-1900-2020_transpose.xlsx
Click on the FIPS row and delete. Typically you would use the FIPS codes to join this data to the existing map of your state, but the county name seems to work better in this case.
Change County to Year (the column header over the years) and Save.
Thus this:
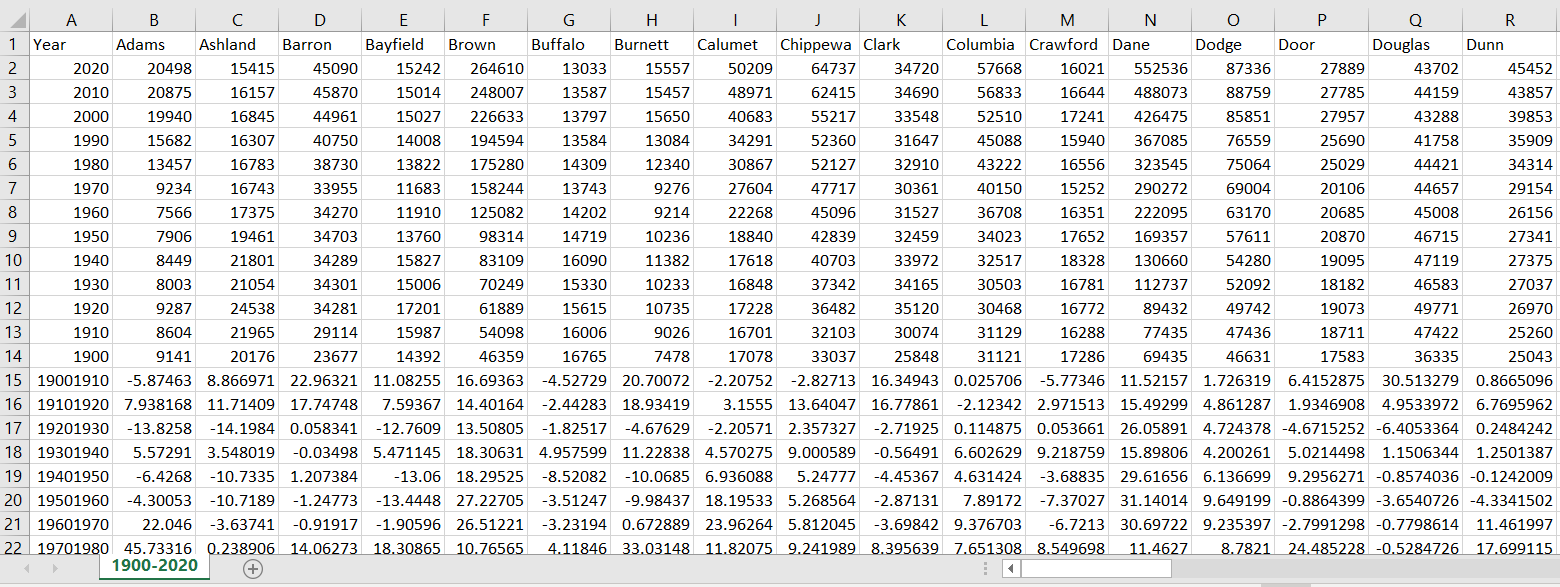
One more task: we need to make one file for the totals and one for the percent change data.
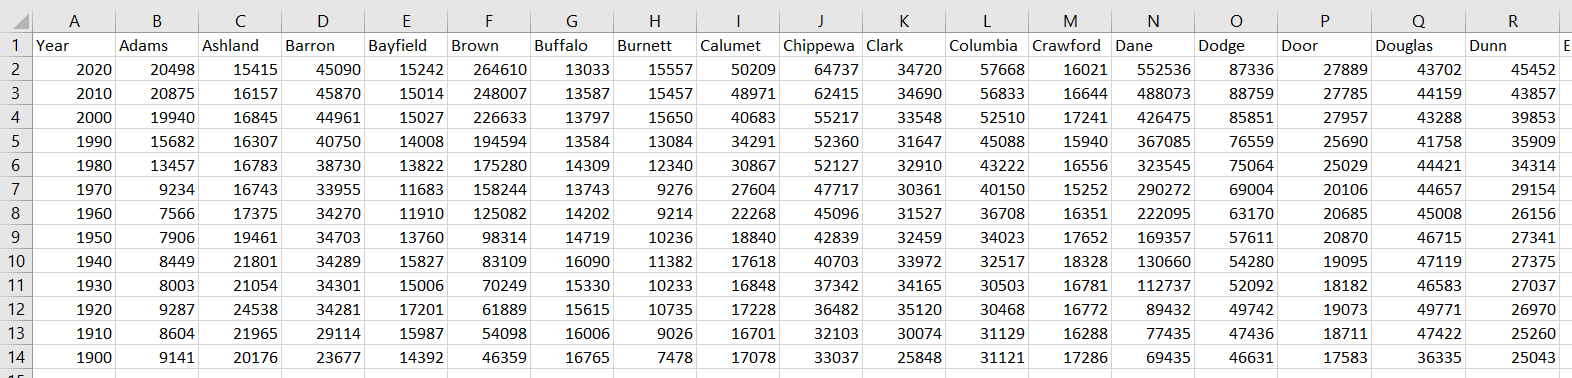
File >> Save as… >> wisconsin-1900-2020_transpose_total.xlsx
Delete the percent population change data and Save.
Final population change data should look like this:
Open wisconsin-1900-2020_transpose.xlsx
File >> Save as… >> wisconsin-1900-2020_transpose_change.xlsx
Copy the rows with the population change data
Skip a few rows below, and Paste Special, then select Values
Delete all rows above, except for the headers.
Change the name of the sheet (at bottom) to 1900-2000 Change
Final population change data should look like this: