Chapter 5-
This chapter starts by explaining the different organizations and components within Web GIS, on top of Esri and how some organizations must have ArcGIS Enterprise to function. This may be due to the lack of internet connection or restriction of connection, if an organization wants to keep their layers within their infrastructure while using online content, or if they want to use functions that are only available through ArcGIS Enterprise. It then defines ArcGIS Enterprise as “an on-premises, user-managed component of the Esri geospatial cloud” or basically a variation of ArcGIS Online with some specific differences. There are multiple components of this. There is Portal for ArcGIS, which is a content management system and can create hosted layers, create web maps and scenes, create host web mapping apps, search for GIS content in an organization, secure access to GIS content, and manage organization utility services. The ArcGIS Server allows the information to be available to other people in the organization or chosen, anyone with internet. Roles of this include, GIS server, Image server, GeoEvent server, GeoAnalytics server, Business Analyst server, ArcGIS knowledge, Notebook server, and Workflow Manager server. The ArcGIS Web Adaptor integrates the Enterprise into the organizations’ web server and security. Lastly, ArcGIS data store makes data available for storage. The chapter then details how to deploy Base ArcGIS Enterprise and the different deployment methods/scenarios.
Chapter 6-
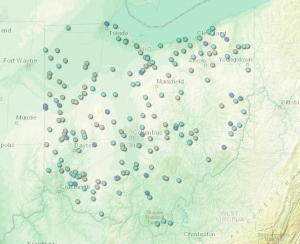
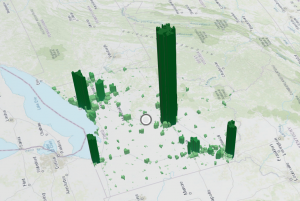
Chapter 6 details how to use spatiotemporal data and real-time updating GIS. I think that it’s amazing that these maps and experiences can update data as needed. There’s different categories of these spatiotemporal data, Moving (like live feeds of vehicles) is basically something that moves, Discrete (like natural disasters) is basically something that “just happens”, Stationary (like highway speed or water levels) is something that stands still but changes as well, and Change (like land use) is just change and growth. These could be at a point in time or over a duration of time. While using spatiotemporal data, you encounter IoT. It’s a network of physical things that are embedded with sensors and network connection that collect data. These are found in a lot of devices like taxis or even sprinklers. There are billions of sensors modernly. Smart homes and smart cities are really helpful to this practice, as they are filled with smart devices that include these IoTs. I find it so interesting that you can use these data sets to animate a map, and create a moving interactive experience for users to convey your mission and findings. This seems to be really helpful to track important things like traffic patterns, population sizes, or natural disaster locations and frequency. This tool is my favorite out of all the functions of ArcGIS online.