Chapter 3 ArcGIS Experience Builder:
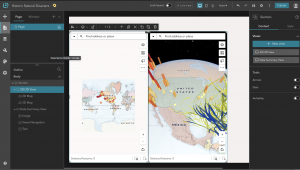
Completing the chapter 3.1-3.6 tutorials was actually really fun to do. I liked seeing the difference between 2D and 3D maps side by side; it gave me a much better perspective on how these kinds of apps can be useful to the public or for charting info. I ran into a small issue with my 3D map failing to download, and had to back track a lot to find a step I missed in order to fix it, but after that it was smooth sailing. I really liked seeing how natural disaster patterns can be charted. I would’ve never thought they could be displayed like this until I saw them for myself in this chapter. I also thought it was cool how many options for widgets there was, not just maps but a ton of different options for both basic things and layout, and even adding the text widget. I like how much info can be thrown into these apps and are able to be articulated to make complete sense to a user by the end.
Application:
From chapter 3, I could use Experience Builder to make a type of interactive map to visualize previous and real-time data on nutrient levels (like nitrogen and phosphorus), and bacteria counts across public ponds in Delaware. The app could have a whole ‘Health Index’ for each pond to help local residents here understand if the water is safe for fishing, boating, swimming, or anything like that. Maybe combine maps + charts + text + widgets? Dashboard style interphase? Also, by adding in data from the Surface Water Quality Monitoring Program, this app would allow its users to track how water quality changes seasonally and identify which ponds are most affected by runoff or algae blooms. (It was easy to pick this topic since I’m doing a research project over the summer that would tie into this data, too.)
Chapter 4 ArcGIS Web AppBuilder:
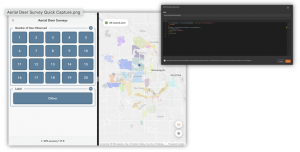
It first explains the advantages that Mobile GIS has over the traditional desktop version. These include mobility (being able to take the device anywhere), location awareness through GPS and cellular data, easy data collection, real-time information, more users, and being overall more versatile. Tutorial 4.1 4.9- first, I designed a survey, which was super cool and taught me a lot about Survey123 as well. I thought the section where I created a webmap using the line layer from before was helpful to learn and to see how different tutorials tie together. QuickCapture was really easy to understand and I could definently apply it’s use to my everyday life. I thought QuickCapture reminded me a lot of an app I have called “picturethis” which allows you to upload or take photos of any plant and will upload it to a data system that identifies what specicies it is, where its located, health, etc. These photos can be uploded to a group and be shared, similiar to the data in these tutorials. Overall I learned a lot from both of these chapters, and I think the fact they are so much more available to mobile users makes them all the more advanced. Both ArcGIS pro and ArcGIS Web have their pros, but the web version caters to a much larger audience and I can already see myself using a ton of these tutorials for other types of projects.