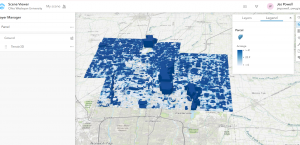
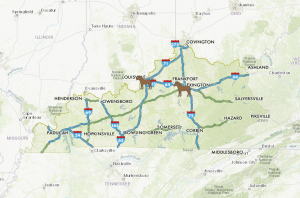
For my final project, I used ArcGIS to look at how easy it is for people in Delaware County, Ohio to get to a public park. I wanted to find out how many houses are close enough to a park to walk there, using a half-mile distance. I used data from the Delaware County GIS website and tools from Chapters 1 to 4 to do this.
Data I Used:
- A map of public parks in Delaware County
- A map of roads in the county
- A list of address points (homes)
- Zoning or land use maps if needed
Steps I Took and Tools I Used:
- Adding the Data and Styling It:
- I downloaded the data from the Delaware County GIS Hub and added it to ArcGIS Pro.
- I colored the parks green and added roads and house points on top so everything was easy to see.
- Making Buffers Around Parks:
- I made a buffer around each park that was 0.5 miles wide to show where people could walk to.
- Selecting Homes Inside the Buffers:
- I used the Select by Location tool to find out which homes were inside the buffer areas.
- Using Attribute Queries and Joins:
- I filtered the data to look at just residential homes.
- Then I used a spatial join to count how many homes were within walking distance of a park.
- Making the Final Map:
- I created a final map that included a title, legend, north arrow, and scale bar.
- I made sure the colors and labels were clear and easy to read.
What I Found Out: I found that a lot of homes in central and southern Delaware County are within walking distance to a park. But some of the rural areas up north don’t have as many nearby parks. This could be helpful for planning where new parks should go.
Conclusion: This project helped me understand how GIS can be used to solve real-world problems. By using buffers, joins, and queries, I was able to find out who has access to parks in the county. In the future, it would be cool to add more info like population or public transport to see how that changes the results.
Building upon the insights gained from Chapters 5–7 , I developed the Delaware Environmental Justice Explorer, an application designed to identify and visualize areas in Delaware where environmental burdens intersect with vulnerable populations. This tool aims to assist policymakers, researchers, and community members in understanding and addressing environmental justice concerns within the state.
Application Features
- Interactive Mapping Interface: Users can explore various layers, including locations of industrial facilities, waste sites, air and water quality metrics, and demographic data such as income levels and racial/ethnic composition.
- Analytical Tools: The application provides tools to identify areas where high pollution levels coincide with vulnerable populations, enabling targeted interventions.
- Community Engagement: Users can submit observations or concerns about environmental issues in their communities, fostering community involvement and data accuracy.
Technical Implementation
- Data Sources: The application utilizes data from the Delaware Department of Natural Resources and Environmental Control (DNREC), the U.S. Census Bureau, and the Environmental Protection Agency’s EJScreen tool.
- ArcGIS Online Capabilities:
- Smart Mapping: To dynamically symbolize data based on attribute values, enhancing visual interpretation.
- Web AppBuilder: For creating a user-friendly interface with customizable widgets.
- Analysis Tools: Spatial analysis to identify overlap between environmental hazards and vulnerable populations.
- Story Maps: To provide narratives explaining the significance of the data and findings.
Use Case Scenario
A policymaker interested in addressing environmental justice can use this application to identify communities in Delaware that are disproportionately affected by environmental hazards. By analyzing the overlap between pollution sources and socioeconomic data, the policymaker can prioritize areas for intervention and allocate resources effectively.

