Luna – Week 4

Chapter 3

Chapter 4

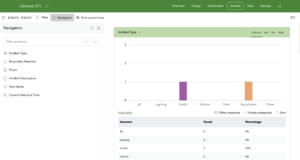
Application: I think that both of these chapters can be used in different ways. I think that the widgets could be used to create a more interactive map of Delaware. The surveys, on the other hand, could be used to collect information and possible direct people that are newer to Delaware.

Week 6 – VanderVelde

Chapter 7:

  • Understand the basic terminology of web scenes
  • know the types of scene layers and technologies to create them
  • create web scenes using scene viewer
  • Understand the value of 3D in XR, meta verse, indoor GIS and AEC
  • Configure 3D symbols in scene viewer
  • Create and use feature layers with z-values enabled

7.2

7.3

Week 5 – VanderVelde

We skip chapter 5!! im so happy!

Chapter 6:

  • understand spatio-temporal data terminology
  • Learn the concepts of IoT, Sensor networks, smart cities and other related frontiers
  • Understand the advantages of stream layers
  • learn about ArcGIS Velocity capabilities
  • Use ArcGIS dashboards to monitor real time data
  • Configure actions and Arcade-based formatiign
  • Create Time-enables web layers and apps to animate time series data

Skidmore Week 5

Chapter 6:

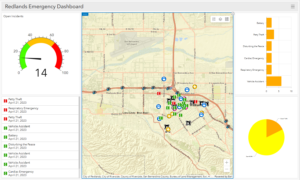
I personally really enjoyed this chapter and how everything was put together. I found everything done had a purpose and could be used in other scenarios, which I found really helpful. Also, the last example seemed a little out of place within the chapter compared to the instance with the dashboard. This was one of the easier chapters as a whole though

.

Munroe Week 6

Chapter 7: 3D Web Scenes

Main elements in 3D scenes

  • Surfaces: Continuous measurements, typically elevation, with one value for a given x,y location
  • Features: On, above or below surfaces. Operational layers
  • Textures: Exterior or interior covers of 3D features
  • Atmospheric effects: Ex. lighting and fog

Web scene layers

  • 3D object scene layers
  • Building scene layers
  • Category layers
  • Filter
  • Integrated mesh scene layers
  • Point cloud scene layers
  • Point scene layers
  • Voxel scene layers

Munroe Week 5

Chapter 6: Spatiotemporal data and real-time GIS

ArcGIS Velocity and GeoEvent Server

  • Ingest: Provides ways to communicate with IoT platforms, sensor networks, social network feeds and other real-time data streams
  • Process: Processes the real-time data received and translated by the ingestion component
  • Output: Sends processed data to a variety of destinations, including writing to a data store, sending data to web clients, alerts through SMS/email

New ArcGIS Velocity Items

  • Feed items
  • Real-time analytic items
  • Big data analytic items

Munroe Week 4

Chapter 3: ArcGIS Experience Builder

Editions of Experience Builder

  • Embedded in ArcGIS Online
  • Embedded in Portal for ArcGIS
  • Developer edition

Widgets

  • Basic Widgets: Functional and can perform as app tools
  • Layout Widgets: Help organize widgets on pages or windows
  • Message Actions: Listen to triggers and perform actions automatically
  • Data Actions: Provide an actions button that users can click in widgets at runtime and select from a list of actions to perform
  • Triggers: Events generated by the source widget
  • Targets: Perform actions responding to the trigger
  • Actions: Specific business logic that the targets perform

https://experience.arcgis.com/experience/8291f9325ace4e2e8652b02dec691471/

Chapter 4: Mobile GIS

Mobile GIS Concepts and Advantages:

  • Mobility
  • Location Awareness
  • Ease of data collection
  • Near-real-time information
  • Large volume of users
  • Versatile means of communication
  • Built on mobile devices, mobile operating systems, wireless communication technologies, and positioning technologies

Week 4 – VanderVelde

Chapter 3:

  • know why and when you need experience builder
  • familiarize yourself with experince builder terminology
  • learn the workflow for creating web apps using experience builder
  • understand widgets and their conent and styles
  • understand triggers and actions
  • configure and use charting, filtering, and other widgets

Chapter 4: 

  • – Understand the concepts of Mobile GIS, LBS, VGI, VR and AR
  • Understand the 3 approaches to building mobile apps
  • Create smart surveys using ArcGIS Survey 123 web designer
  • Collect data using survey123
  • Configure Editable feature layers and feature templates

For 4.3 step 17, I am literally so confused, Krygier you posted a photo i think to go with the question but i dont know what that means and its 10:10pm rn.

I did it, this seems like really easy rn but also its very tedious which makes it harder to get done.


Munroe Week 3

Chapter 1: Get started with Web GIS

Objectives:

  • Grasp the concept and advantages of Web GIS
    • Global reach, large number of users, low cost per user, better cross-platform abilities, easy to use and maintain
  • Understand the deployment patterns of Web GIS
    • Esri managed and customer managed
  • Learn the components of the new-generation of Web GIS
    • Portal which represents a gateway for accessing all spatial products in an organization. Helps to organize, secure and facilitate access to products
  • Understand the technical evolutions and trends in Web GIS
    • From closed websites to open geospatial web services
    • From one-way to two-way information flow
    • Portal technology is becoming essential
    • Cloud GIS delivers GIS functionality and ready-to-use contents
    • Mobile is becoming the pervasive Web GIS client platform
    • Map visualization goes from 2D to 3D and virtual reality
    • Data source goes from static to real time and spatiotemporal big data
    • Web GIS is becoming more intelligent
  • Understand the concepts of web services and hosted feature layers
    • Main content types: Data, layers, web maps and scenes, tools and apps
    • Hosted layers refer to a situation in which a web service is based on ArcGIS managed data, stored in the ArcGIS Online cloud database or in ArcGIS Data Store
  • Publish hosted feature layers from CSV files
  • Learn the workflow for creating web maps and web apps

Example Application: A map, like the tutorial, showing locations of former fraternity and sorority houses in the historic Northwest neighborhood of Delaware. Images (PNG) and text from the Delaware Historical Society for each house and possibly alumni quotes.


Chapter 2: Smart Mapping and Storytelling with GIS

Types of hosted feature layers:

  • Hosted feature layers
  • Hosted Web Feature Service (WFS) layers
  • Hosted tile layers
  • Hosted vector tile layers
  • Hosted Web Map Tile Service (WMTS) layers
  • Hosted scene layers
  • Hosted image layers
  • Hosted map image layers

ArcGIS Living Atlas of the World

  • Dynamic collection of layers, maps, tools and apps produced by Esri and thousands of contributors

StoryMaps

  • Storytelling (used this so many times for Ashley Allen’s classes and other final projects)

Link to StoryMap: https://arcg.is/1L5D1u0

Example Application: Interactive StoryMap visualizing the population change/decline in Newfoundland and Labrador fishing cities.

Buroker Week 6

Ben Buroker

Spring 2023

Geog 192

Dr. Kyrgier


Week 6:

Assign: Read and complete GTKWGIS chapter 7. Create a new blog entry with comments, notes, and questions on these readings. This is: <Your Name> Week 6

  • Include a few-sentence description of an application based on ideas from chapter 7, using your own data or the Delaware Data (from Geog 191). This edition of the tutorial includes ideas under “Assignment” (p. 35 in the 5th edition of the tutorial).

Write-up: 

The terminology of “web” and “3D” for 3d scenes/maps are important to remember. It is intuitive that another dimension of data will improve the visualization, analysis, and communication of a map. The two types of 3d scenes are photorealistic scenes and cartographic scenes. Photorealistic use photos to create features and cartographic uses 2d thematic mapping techniques to display features which may not be as visual. There are a multitude of ways you can represent the 3d images or data. I think the point cloud maps are cool because they provide some context to the lidar data that I have heard Dr. Rowley talk about quite a bit. It’s cool to see what lidar data would look like when compiled into a 3d map. I got a little lost when they started talking about all the r’s, AR, VR, XR, MR… it’s a lot.

Exercise 7.1:

I couldn’t do 7.1 because this was the description it gave online on how to do it… This is the same problem from earlier in the book; where the instructions didn’t include the ending of the paragraph. I fixed this for future chapters by using the hard copy of the book from the GIS lab, no the ebook.

Exercise 7.2:

I’m having some issues with this exercise because it is asking me to choose “population per square miles” when it is not an option that I have in the drop down menus. I am instead using “population density” whenever I am asked to do this. I feel like it is close to if not the same as pop. per sq mi.

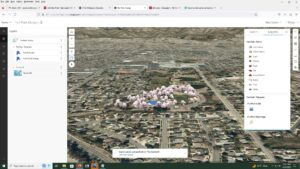
This is my web scene after completing 6.2. The spike in Washington is weird and I don’t know how to address it…

Exercise 7.3:

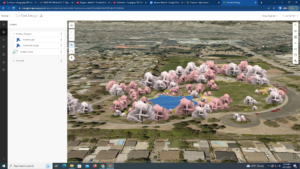
Making the “fun park” was enjoyable and pretty straightforward. It made me feel like an architect but it was actually really useful to see how you can format a 3d scene to make it look “pretty” or a certain way for a specific layout/project.

Exercise 7.4:

There is something going on with arc online when formatting the park walls towards the end of exercise 7.4. When you are asked to select the “height field” from a drop down box, there is one option with text and two blank options (pg 258). I believe some of my buildings don’t have walls because of this glitch.

Exercise 7.5:

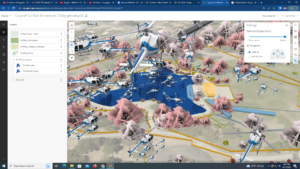
This section was difficult. I had no trouble adding the car, but for some reason once I tried to add a helicopter my map became overrun by helicopters of various sizes. I only completed all the steps to add two to my map… so I don’t know why there are so many.

Exercise 7.6:

This exercise was cool. It was good to see all the measure tools. It was kind of frustrating trying to navigate the movement controls of the 3d map with my laptop though. It was hard to use my trackpad and the online wifi made the map a little glitchy I think. I would be interested in trying to do this sort of navigation on one of the wired PC’s and with a mouse.


Potential Application: 

I can see a 3d scene being used to make a map of a location in Costa Rica from Dr. Rowley’s Bahia Ballena project. I think if we had the basemap data or images we could add in the surrounding “stuff” like trees, buildings, and walls and format/place them in the correct spots. I think a 3d scene like the ones I made above could be a good tool to help people at OWU who haven’t been to Bahia Ballena visualize the town and better understand what is going on. The adding and formatting of the 3d scenes was pretty straightforward, I just don’t know what kind of data you need to begin the process.Â