Pois Final

For my first app, I wanted to look into StoryMaps from Chapter 3. I ended up making a story map revolving around Sanibel Island, which is where my family and I used to travel every summer. Unfortunately, the majority of the island was wiped out by Hurricane Ian, so all of the pictures included are pre-hurricane. I customized how the story looks and it was actually a lot of fun, and I set up a tour of all of my favorite places we would always visit.  I was able to see a preview of how it would look on different devices, and it was cool to personalize everything. I think it would be fun to utilize this feature for a project/presentation.

https://storymaps.arcgis.com/stories/96078b1a1a0348b7a42b9837d533e973 

For my second app, I wanted to try out the 3D web scenes. I stuck with the same location and used Sanibel Island, and I found data that revolved around one of my favorite places included in my story, which is Ding Darling Wildlife Preserve. The data revolved around various tree species within the preserve, so I applied the layer and then made the trees/plots 3D, identified the species of trees in each area, and applied the labels. It was interesting to see the variation of things that I could do with the 3D functions and the data.

https://owugis.maps.arcgis.com/home/webscene/viewer.html?webscene=1b336d4731864293b4162ad4bb11b488 


Pois Week 5

Chapter 7: 3D Web Scene

The basics:

Scenes can be grouped into two main types

Photorealistic: Aims to re-create reality using photos to texture features. These types of scenes often use imagery as the texture and are extremely well suited for showing visible objects, such as a city.
Cartographic: Takes 2D thematic mapping techniques and moves them into 3D. These types of scenes often use attribute-driven symbols (extrusion height, size, color, and transparency) to display physical, abstract, or invisible features such as population density, earthquake magnitudes, flight paths, zoning laws, solar impact, and air corridor risks.

Main elements in scenes

Surfaces: Surfaces are continuous measurements, typically elevation, with one value for a given x,y location. Surfaces provide the foundation for draping other content. Surfaces are often referred to as a digital elevation model (DEM), digital terrain model (DTM), or digital surface model (DSM).
Features: Live on, above, or below the surfaces. They can be 2D layers or 3D scene layers. These features are operational layers of your 3D app.
Textures: Provide exterior or interior covers of your 3D features. Textures often use aerial imageries or cartographic symbols.
Atmospheric effects: Examples include lighting and fog.

Web scenes and web scene layers

3D object scene layers: These layers can be used to represent and visualize 3D objects, such as textured or untextured buildings. 3D object scene layers can be created manually or automatically using procedural rules.

Building scene layers: Building scene layers allow you to visualize complex digital models of buildings and interact with all the components of the building. With building scene layers, you can explore a building’s composition, properties, and locations of structures in a building digital model.

  • Overview: Optional layer that allows you to view the 3D building as a single layer. The overview can be created from the exterior shell defined in the building layer.
  • Discipline: Combines category layers into the various work disciplines of a building, such as architectural, structural, mechanical, plumbing, or electrical.
  • Category layer: Represents individual categories, such as windows or walls, organized in disciplines. Category layers are 3D object scene layers. You can change the symbology or change other properties of the layer.
  • Filter: Allows you to view details in complex buildings. With a filter, you can choose to show only elements with specific attributes as solid or show others in wire frame mode.

This particular section seems like a lot of fun. the first thing that comes to mind when considering how I would use it is creating a plot of property that I hope to one day achieve at some point in my life, we’ll see though. I really like the idea of having space for a home, a few animals, a pond and a small community space where individuals could sell locally made goods, as well as an outdoor education space for kids. I would like to just lay this out and play around with what this could look like structurally.

Pois Week 4

Real-time GIS is used to handle objects and events that move, appear, and change through time.

  • Spatiotemporal data comes from many sources, ranging from manual data entry to data collected using observational sensors or generated from simulation models.
  • Real-time GIS refers to GIS that handles current and continuous data, which can be the latest position, altitude, speed, direction, temperature, pressure, concentration, or water level of various sensors and other objects.
  • IoT is the network of physical objects, or things, embedded with sensors and network connectivity that enable these objects to collect and exchange data.

ArcGIS Velocity introduces new types of items to ArcGIS, including feed items, real-time analytic items and big data analytic items.

The temporal nature of real-time data allows you to establish a time series or intervals of time and you can:

  • Display discrete events, such as crimes, accidents, and diseases, over time.
  • Visualize the value change at stationary objects, such as air-quality sensors and weather stations.
  • Map the progression of a wildfire, flood, land use, or environmental change over time.
  • Replay the events of an emergency, review when and how different departments responded, and learn from the past to improve emergency management and responses.

Using the information/tutorial from this chapter, I could create a display showing change over time or create a web map with real-time layers. For example, I could potentially gather data from the cameras that overlook the main jaywalk crosswalk and create a web map with real time data of it to track incidents. I’d be interested to see if this could be used to gather data about the number of cars that run red lights or fail to yield to students at other crosswalks.

Pois Week 3

Chapter 3:

Experience Builder has the following workflow for creating web experiences: Pick a premade template or start from scratch, select a theme, add source data, add and configure widgets, refine layouts for all devices, save, and publish.

Basic components: A widget is a JavaScript and HTML component that encapsulates a set of focused functions. Experience Builder provides two types of widgets: basic and layout. Basic widgets include map, legend, layers, query, filter, edit, chart, elevation profile, survey, and more. Layout widgets include sections, columns, rows, fixed panel, sidebar, and more.

The next part of this chapter runs through a tutorial with step-by-step instructions, so it helps to have the book right by you while completing it.

Chapter 4:

Mobile GIS Benefits: Mobility, location awareness, ease of data collection, near-real-time information, large volume of users, versatile means of communication

There are several ways that Mobile ArcGIS can be utilized, including planning and coordinating fieldwork, indoor and outdoor operations, and various mobile app development strategies. The book once again has descriptions of each step you need to follow if you are completing an assignment.


Pois Week 2

Chapter 1:

Web GIS has five main types of content: data, layers, tools, web maps and scenes, and apps. 

There are different user types that have access to different app bundles and apps.

Viewer – can view items but can’t create, edit, share, or analyze items

Storyteller – Can create stories and express maps but can’t create other types of content

Editor – Can view and edit data but can’t analyze, create, or share items

Field Worker – Same as Editor

Creator – Can edit, create, share content, and do analysis

GIS Professional – Same as Creator

Insights Analyst – Same as GIS Professional

Components of GIS:

Basemap layers: Basemaps provide a reference or context for your app.

Operational layers: Operational layers are theme layers that you and other users can use and interact with. You can use existing layers from ArcGIS Online and ArcGIS Living Atlas of the World as your operational layers.

Tools: Tools perform tasks beyond mapping, including common tasks such as query, geocoding, routing, and more specialized tasks. 


Chapter 2:

Types of hosted layers 

Hosted feature layers: These layers support vector feature querying, visualization, and editing. Hosted feature layers are most appropriate for visualizing data on top of your base maps.

Hosted Web Feature Service (WFS) layers: These layers are Open Geospatial Consortium (OGC) WFS standard-compliant

Hosted tile layers: These layers support fast map visualization using a collection of pre-drawn map images or tiles.

Hosted vector tile layers: These layers reference a set of web-accessible tiles containing 2D and 3D vector content and the corresponding style for how those tiles should be drawn

Hosted Web Map Tile Service (WMTS) layers: These layers are OGC WMTS standard-compliant.

Hosted scene layers: These layers support fast map visualization of 3D data using a collection of cached tiles.

Hosted image layers: These layers can display raster data by dynamically combining various bands, and they support the dynamic analysis of raster data, such as imagery and other information captured by remote sensing devices.

Smart mapping

Heat map: Displays the relative density of points as smoothly varying sets of colors ranging from cool to hot. Available to point features only.

Color and size: Uses symbol color and size to show one or two numeric fields.

Compare a to b: Displays the relationship between two numeric fields using ratio or percentage.

Relationship: Visualizes the relationship between two number fields using bivariate choropleth mapping.

Dot density: Uses dot density (and color) to display the distribution of one or more numeric fields.

Predominant: Displays the predominant category or level of predominance among two or more fields.

Type and size: Represents numeric fields by size and category fields by color.

Continuous timeline: Uses colors or sizes to represent data sequentially from new to old.

Vector field: Uses direction and magnitude to display imagery data


I recently read about how there is a species of beetle that will likley become highly invasive in the future, so I would be curios to see if I could find data about the abundance of this species and highlight the prime locations of the most dense populations of beetles. I could do this by selecting the feature layers I wanted to display, or mabe creating a dot density map of the data.
Pois Week 1

My name is Zoie Pois and I am a senior double majoring in Zoology and Environemntal science.

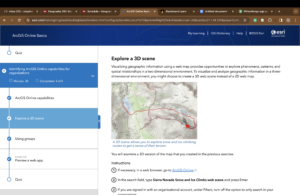
I poked around a bit and looked through the various tabs at the top to see what each one correlated with. Under gallery, there were things from 2020, including this image of floods I didn’t really know happened on campus. 

Under Esri, I was told, “To get connected to My Esri, you need an invitation from your My Esri administrator. This may be your organization’s Primary Maintenance Contact”

I think the mobile aspect of ArcGIS online seems really beneficial for moving around out in the field and collecting data for projects. 

I believe I already completed the remaining things for week 1 during Geog 291