White Week 5

For Chapter 7, I explored how to create and configure web apps using Web AppBuilder for ArcGIS. The chapter covered how to use themes, widgets, and map services to build interactive and functional applications that are user-friendly and highly customizable. I found it interesting how much flexibility the app builder gives users without requiring any coding knowledge.

One concept I found especially helpful was how different widgets can enhance user interaction. For example, the Layer List and Legend widgets provide clarity, while tools like the Query or Filter widgets make the app more dynamic for exploring specific patterns in the data. I also learned how to publish a map from ArcGIS Online and integrate it seamlessly into a Web App.

Application Idea

Using the Delaware Data from Geog 291, one idea I have is to create a Crime Density and Services Map. It would visualize locations of recent crime reports in relation to public services like police stations, hospitals, and schools. The goal would be to examine whether areas with higher crime incidents are underserved by key services. I’d use point data for incidents and facility locations, with buffers and density mapping to highlight spatial relationships.


White week 4

In Chapter 6 of Getting to Know Web GIS, the focus was on spatiotemporal data and the use of real-time GIS, tile layers, and on-premises Web GIS systems. One of the most interesting takeaways was how tile layers are used to efficiently deliver basemaps or large raster datasets over the web, allowing for fast and smooth map performance. The chapter also explained the benefits of hosting Web GIS on-premises, which is especially valuable for organizations that work with sensitive data or prefer local control over cloud-based hosting. Tools like Esri’s GeoEvent Server enable real-time processing of streaming spatial data, which opens the door to powerful applications such as live traffic monitoring, environmental tracking, or emergency response systems.

A few questions I had while reading include: what are the main limitations of on-premises Web GIS compared to cloud-hosted platforms? And can tile layers be updated dynamically with real-time data, or are they mainly used for more static visualizations?

Based on ideas from Chapters 5 and 6, one application I would be interested in developing is a real-time air quality monitoring dashboard using the Delaware Data from Geog 291. This dashboard would use tile layers for the basemap and historical context while integrating spatiotemporal data streams from air quality sensors placed throughout the state. The system could track variables like PM2.5 and ozone levels and display live readings with visual alerts for high-pollution areas. This type of application could be extremely useful for public health officials, school systems, and residents concerned about environmental quality—especially during times of wildfire smoke or industrial emissions.

White Week 3

In Chapters 3 and 4, I learned about two powerful tools for creating interactive GIS applications: ArcGIS Experience Builder and ArcGIS Web AppBuilder. Both platforms allow users to create custom web applications, but they differ in terms of flexibility, functionality, and user interface.

Experience Builder felt like a more modern and customizable tool, especially with its drag-and-drop interface and responsive design features, making it well-suited for creating apps that work across devices. I found the widgets library to be highly versatile and liked that you can integrate dashboards, maps, and charts all into one seamless app.

Web AppBuilder, while slightly older, still offers strong tools for fast map-based application development. I appreciated its ready-to-use templates and the large collection of widgets, which are very helpful for creating simple, functional web apps without coding.

Application Idea (Based on Chapters 3 & 4)

For my application, I plan to use Delaware Data from Geog 291 to create a web app highlighting Delaware flood risk zones using Experience Builder. The app will allow users to view flood-prone areas, compare them with demographic data, and access links to emergency preparedness resources. By using interactive widgets, users will be able to filter the map by county, flood zone severity, and population characteristics. This app will be helpful for both public awareness and local decision-making.

Delaware Data Inventory

I have already completed the Delaware Data Inventory assignment previously in Geog 291.


White Week 2

In Chapters 1 and 2 of Getting to Know Web GIS, I was introduced to the foundations of web GIS and how it connects with the broader digital geography ecosystem. I learned how ArcGIS Online is not only a mapping platform but a full suite of tools that supports interactive mapping, data sharing, and spatial analysis through the web. What stood out most was how easy it is becoming for non-experts to engage with spatial data through intuitive interfaces and web apps.

Chapter 1 discussed the growth and importance of Web GIS in the modern world, with examples across government, business, education, and environmental fields. Chapter 2 covered the basics of creating web maps, publishing data layers, and configuring pop-ups and symbology. I appreciated the real-world examples that showed how GIS is used to solve spatial problems and communicate stories effectively.

Application Idea Based on Chapters 1 & 2

Using the Delaware Data from Geog 291, I’d like to create a web map showing broadband access gaps across different counties. I could layer internet speed data, demographic information, and educational access points to highlight areas where underserved communities may lack reliable internet. This could be useful for policymakers or school districts trying to allocate funding for digital access programs.

White Week 1

Hi everyone! My name is Will White, and I am a Business Management major at Ohio Wesleyan University. I am also a member of the OWU men’s lacrosse team. I am excited to start this course and explore how Web GIS can be applied in different industries, including business and sports analytics.

I accessed my OWU ArcGIS Online account and explored its features, including My Profile, My Settings, My ESRI, Training, Community and Forums, ArcGIS Blog, and Help. I updated my profile information and found that the Training section offers a wide range of courses, many of which are free for OWU students. The ArcGIS Blog provides industry updates and case studies, which I found useful for learning about real-world applications of GIS technology.

I read through “Get Started: What Is ArcGIS Online” and learned that ArcGIS Online is a powerful platform for creating interactive maps and analyzing geographic data. One of the most valuable features is the Living Atlas, which provides access to a vast collection of datasets that can be integrated into projects. Another key takeaway is that ArcGIS Online enables collaboration by allowing users to share maps and data with others, which is beneficial for businesses, researchers, and community organizations.

I completed the ArcGIS Online Basics course, which introduced me to core GIS concepts. The course emphasized how feature layers allow for detailed data visualization, making it easier to analyze trends across different locations. I also learned about the Web AppBuilder, which enables users to create interactive applications without needing to code. This makes GIS tools accessible to people who may not have a technical background but still need to leverage geographic data in their work. I have attached screenshots of my course completion for reference.
While exploring additional ESRI training opportunities, I found two courses that seem particularly interesting. The first is “Spatial Analysis with ArcGIS Online,” which covers in-depth mapping and analysis techniques that could be useful for data-driven decision-making. The second is “Cartography with ArcGIS,” which focuses on effective map design and data representation. These courses could help me improve my GIS skills beyond the basics and apply them to business-related projects.

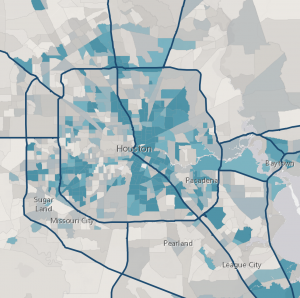
For my GIS applications research, I looked into two real-world uses of ArcGIS Online. The first is a map created to visualize evacuation routes and impacted areas during Hurricane Harvey in Houston, Texas. GIS was used to track flooded zones, population density, and shelter locations in real time, helping emergency responders and city officials make faster, more informed decisions. This application of GIS showed how spatial data can play a critical role in disaster response and urban planning. The map displayed not only road closures and water levels but also helped optimize the movement of people to safety.

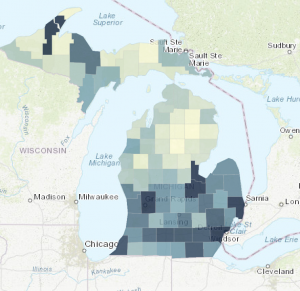
The second project I explored is a historical population map of the state of Michigan from 1900 to 2020. This interactive GIS map visualizes demographic changes over more than a century, showing growth patterns, urbanization, and population shifts between rural and urban counties. It helps users understand how migration, industrial changes, and economic development have affected the state’s population distribution. Tools like these are particularly useful for researchers, city planners, and policy makers who want to visualize long-term trends in a clear and accessible format.