I made a story map about three different native american heritage sites around Ohio
https://storymaps.arcgis.com/stories/54db020339914f5a81d0cf9cb48ed5a3/preview
Geography 292: Geospatial Analysis with Web GIS
Module 2: 3/16/2026 - 4/28/2026, OWU Environment & Sustainability
I made a story map about three different native american heritage sites around Ohio
https://storymaps.arcgis.com/stories/54db020339914f5a81d0cf9cb48ed5a3/preview
Chapter 7
Chapter seven had me creating 3D images of the United States. The 3D element was really cool. It’s so clear how useful online GIS can be used for city planning and development. It also made me realize how GIS and AutoCAD could be used together. It was also cool to see all the different ways it could be used for citizen science.
One Idea for an application would be to see the unemployment rate for each state. Then, maybe you can have a separate map showing the population of each state. I think it would show how the relationship exists between small and larger cities.
Chapter 5
In this chapter I worked on connecting ArcGIS Pro with ArcOnline. I thought it was cool how the two could be connected and interact with each other in real time. I also worked on publishing tile layers, which make online GIS so much easier. I had a little bit of trouble connecting the two, but it was really interesting when I finished. The side-by-side component was really cool too, and it’s clear to see how all these applications would be great for citizen science.
Chapter 6
Chapter six brought together the two main aspects of geography, space and time. Known as spatiotemporal data, it allows the user to see spatial changes/movement over time. The chapter also talked about data that is constantly being collected. Things like camera feeds, google searches and more. I thought this chapter was really cool, and the exercises really showed the application of the techniques.
Chapter 3
Chapter three show how to use apps to show how data changes over time. It also showed a various amounts of widgets that make map making that much easier. I really liked looking at this part. Maps that have a slider always seem so cool to me. I also think it is a great way to share scientific/technical findings with everyday citizens who may not know how to read maps. These maps combined with story maps are the perfect combo.
One application for this could be showing the growth of urban developement by a river and how the river changes over time.
Chapter 4
In this chapter, we looked at mobile GIS. I thought this part was really cool. I want to do field research someday, and the idea of being about to plot study sites on the go rather than having to sit down at a desktop was really cool. I think some of the VGI features were really cool too!
An application for this chapter could be used to determine animal sightings for hunters or conservationists. Another one I thought was funny was to use it to see where the police sit on the road the most to avoid a ticket. But that’s a joke.
Chapter 1
Chapter one was pretty fundamental. it goes over the basics and core concepts of Web GIS. it points out well how GIS isn’t just for Geography nerdz (yes with a z). GIS is really an application the can go toward any proffesion. The apps were also fun to search around for.
Chapter 2
Chapter two was a lot more specific as it went over the feature layers. it also brought together the idea of storymaps. I am a huge fan of story maps because it’s (in my opinion) the best way to get “non-science” citizens connected with the scientific community.
Overall between the two chapters it have been interesting. I think I still perfer using ArcPro for most work, however I can see that WebGIS is better and more applicable at times. I am excited to see the other ways it can be used in the upcoming weeks. And I am excited to see if it changes my prefence of software.
Hi! My name is Samuel Baer. I am a junior from Mt. Gilead Ohio studying environmental science and geography.
I took the quiz and I have made my appointments for weeks 2 and 3.
Poking around the account was interesting. I wish My ERSI was a little more accessible but it’s fine. Also I think it was funny to see some of the community posts. Some of them were interesting, and some of them were a little strange.
The starting page was fine. I felt like the training was better at explaining everything, but if I was trying to refresh myself this article would be fine. It is a really good spot to quickly trouble shoot any issues.
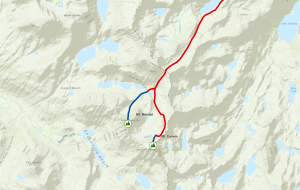
The training wasn’t as meticulous as I was expecting. I liked that we were doing the practice maps with mountains, just because I like that kind of stuff. I also thought the 3D imaging was cool. To be honest I would do that to plan a hiking or backpacking trip.
One of the two applications I found was of Indian Ocean Ostracod sites. Having these sites mapped out allows them to overlay them with other environmental factors like wind and temperature.
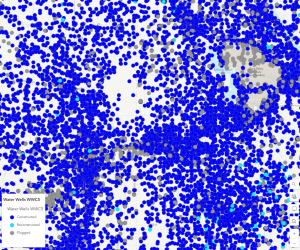
I liked these because they both felt like extremely practical applications for GIS. They seem like they would be really useful longterm.