Gullatte final

I made an app based off of the first few chapters we read. I made an app that allows people looking specifically for condos in Delaware to do just that. It is interactive so it allows you to click the locations of the condos. It will tell you the name and the numbers of lots it has in total. My plan was for this to be a mobile app so people looking for condos could do it with ease. I think I turned the data into a scene and then uploaded it to the final app. 

https://owugis.maps.arcgis.com/apps/instant/3dviewer/index.html?appid=132633a1a10e4bb39714dd17acf158c5

This map is sort of an exhibit map. I used the 911 data from Delaware county to show others the heavily populated areas and if they were to build a new police station, where I would put and why. It is a neat concept and you can go through each slide that I presented and see what specific area I am talking about. This could be useful if presented in a better manner to the government if they were planning to build more police stations. 

https://owugis.maps.arcgis.com/apps/instant/exhibit/index.html?appid=67c83c5ef3c3428c88a80d9fe9287bf2

Gullatte week 5

 Chapter 7 –

Basics of 3D GIS- 

In ArcGIS web maps are referred to as web scenes or 3D scenes. GIS is a critical component for research frontiers and hot spots including digital cities, geodesign, indoor mapping, AEC, VR, AR, and the metaverse. I think this is all really cool because this is becoming our future very quickly. 

A web map can have many layers. 

Photorealistic: Aims to recreate reality using photos to texture features. These types of scenes often use imagery as the texture and are extremely well suited for showing visible objects such as a city. 

Cartographic: Takes 2D thematic mapping techniques and moves them into 3D. These types of scenes often use attribute-driven symbols to display physical, abstract, or invisible features such as population density 

Main elements in scenes: 

Surfaces: Surfaces are continuous measurements, typically elevation with one value for a given x,y, location. 

Feature: Live on, above, or below the surfaces. They can be 2D layers or 3D scene layers. 

Textures: Provide exterior or interior covers of your 3D features. 

Atmospheric effects: Examples include lighting and fog. 


Other key definitions: 


Building scene layers: Building scene layers allow you to visualize complex digital models of buildings and interact with all the components of the building. 

Overviews: Optional layer that allows you to view the 3D building as a single layer. 

Discipline: Combines category layers into the various work disciplines of a building, such as architectural. 

Category layer: Represents individual categories such as windows or walls. 

Filter: Allows you to view details in complex buildings. 

3D across ArcGIS- ArcGIS provides a suite of 3D products to support the creation, visualization, analysis, and sharing of 3D scenes. 

ArcGIS Pro: A desktop app that provides comprehensive tools for managing 2D and 3D data and authoring and sharing 2D maps or 3D scenes. 

ArcGIS CityEngine: A desktop app that provides advanced 3D creation capabilities. 

ArcGIS Online and ArcGIS Enterprise: Web GIS platforms that can host scene layers for online and on-premises 3D web GIS apps, offer scene viewer.

For this, I would create a web scene using 3D objects and symbols. This could help with the distribution of students who are in a certain school district. Some of the school districts are really big and others are really small. Creating a web scene would allow me to plan the school districts differently and see how it would look in a realistic setting. You can even add trees and walls.  

Gullatte Week 4

Chp. 6

Time is an important dimension of GIS Data. You can imagine how time is important to GIS data including showing change throughout a certain time period or just when and where an activity was observed. That’s all time. There’s four keywords to this. 

Moving: cars, ambulances, airplane feeds

Discrete: criminal incidents. Earthquakes, instagram feeds. 

Stationary: wind speed, highway and street traffic speed

Change: flooded areas, land use and land cover changes 

In spatiotemporal GIS data, the time of an event can be duration or a point in time:

Point in time: The moment a lightning strike occurs

Duration in time: When a wildfire starts and ends. 

Key terms:

Time measurement in other words: Time can be expressed in many units such as in years, months, days, etc. 

Time reference systems(time zones): The most often used time zones are GMT and UTC. Both reference the prime meridian. 

Time representations: Time can be represented in different formats and languages 12/18/2020 or write it out. 

Temporal resolution: refers to the time interval at which events are sampled. 

IoT: The network of physical objects, or things embedded with sensor and network connectivity that enable these objects to collect and exchange data. This can be in airplanes, heart monitors, taxis, and more. 

Enterprise IoT applications: Include smart cities, infrastructure management, environment quality monitoring, small retail-inventory management, and precise agriculture. 

Consumer IoT: include connected cars, connected health and smart homes. 

ArcGIS Analytics for IoT and GeoEvent Server share similar components. 

Ingest: This component interacts with various data sources. IT provides ways to communicate with IoT platforms, sensor networks, and more 

Process: This component processes the real-time data received and translated by the ingestion component. 

Outputs: The output component sends processed data to a variety of destinations. For example, sending alerts via email or SMS. 

Other key definitions

Feed items: Allows users to received sensor inputs

Real-time analytic items: Allows users to perform real-item processing of those inputs including triggering alerts and actions. 

Big data analytic items: Allow users to access and analyze big data repositories of historical observations.

Poll: the traditional approach in which a client periodically polls the server to retrieve the latest data. 

Push: a new way to serve data in near real time using the HTML5 WebSocket protocol. 

For this, I would make a dashboard app based on the voting precincts in Delaware County. We know that voting is becoming more and more important each election so making a dashboard based on this could be ideal. The app would just be taking the users location and showing them all the precincts in the area and what time they close. It would also point and give them directions to the closest precinct according to their app’s location. 
 

Gullatte week 3

Chapter Three:

Widgets: A JavaScript component that encapsulates a set of focused functions. 

Basic Widgets: functional widgets that can perform as app tools. 

Layer widgets: The containers that help organize widgets on your pages or windows. 

  • Using experience builder to make web experiences.

Pick a premade template or start from scratch, select a theme, add source data, add widgets, and finally refine layouts. 

  • The basic components: 

A web experience has at least one page. Pages and windows are the backbone of these web experiences. Widgets should be added as well. 

Pages: A document that is the foundation for the app’s layout. A page has 3 main elements including a header, a footer, and a body. 

Windows: Complementary to pages. Windows only has body content. The common uses of Windows are splash, alert, confirm, and Tool Tips. 

Chapter four: 

Mobile app development: There are many different approaches to this including: 

Browser-based approach: builds apps using HTML, JavaScript, and Cascading style sheets. This strategy has the potential to reach all mobile platforms. 

Native-based approach: This requires native development skills like Java for Android. These apps have deep-level access to device hardware and other resources. These apps are often more expensive. 

Hybrid-based approach: Integrates native components and HTML to build native applications. More advanced methods include the use of frameworks to allow for deeper integration with the native platform. 

API- ArcGIS offers APIs which stand for application programming interface. ArcGIS API for Java supports both browser-based and hybrid-based. ArcGIS Runtime software development kits(SDK) for IOS. ArcGIS Runtime SDK for Android and ArcGIS Runtime SDK for Qt support native based approach. It’s a very complicated system. 

  • Ultimately API’s offer similar core functionalities like editing and graphics, and the ability to access ArcGIS web and map services. 

ArcGIS Indoors- I thought this was cool because this platform was made so you can take it on the go which made me think of the outdoors, not the indoors. They describe ArcGIS Indoors as providing an indoor mapping experience for understanding the location of things and activities happening within your organization’s indoor environment. 

They give us a few phrases to help us learn Indoor GIS. 

Wayfinding and navigation: ArcGIS Indoors interacts with Bluetooth and wifi indoor positioning systems to show users where they are on an indoor map, where to go, and how to get there. 

Calendar integration: this app allows users to see where their scheduled meetings are located and navigate between them, knowing estimated travel times and avoiding being late for important events. 

Explore and search: This app allows users to explore and search for specific people, activities and events, offices and classrooms, and other points of interest. 

Location sharing and tracking: Users can share their locations. Organizations can identify employee locations to support directing resources or others to support ongoing activities. 

  • I was thinking of developing a mobile app that was centered around condos in the Delaware County area. The Delaware area is building a lot of new condos and developing new neighborhoods. This app would be useful for younger people looking to move to Delaware. This app could also include the school district so if buyers are pickier, they can specifically look at school districts with condos available in that area.

Gullatte week 2

Chapter One: 

This chapter was kind of a basic introduction chapter of all the concepts needed to understand Web GIS. Web GIS is the combination of the web and geographic information systems. The first operational GIS was made in the 60s. Since then GIS has developed from a local file-based single computer system to a central database clients/server system. 

WebGIS has many advantages including the following:

Global Reach:  You can share geographic information easily, within your organization and with people all over the world. 

Large number of users: You can share your app with dozens, or even millions supported by scalable cloud technology 

Low cost: per user: The cost of building one web gis app is lower than building a desktop solution

Better Cross-platform capabilities: web apps can run on desktop and mobile platforms 

Easy to use: Web GIS apps incorporate simplicity and intuition. 

Easy to maintain: web clients can benefit from the latest programs and data updates each time they access a web app. 

This chapter shows you how to create web maps in a few different ways. 

Chapter Two:

Types of hosted layers-

Hosted feature layers: these layers support vector feature querying, visualization, and editing. Most appropriate for visualizing data on top of your base maps. 

Hosted Web Feature Service layers: These layers are open geospatial consortium WFS standard-compliant

Hosted tile Layers: these layers support fast map visualization using a collection of pre-drawn map images or tiles

Hosted vector tile layers: These layers reference a set of web-accessible tiles containing 2D and 3D vector content and the corresponding style for how those tiles should be drawn

Hosted web map tile service layers: these layers are OGC WMTS standard-compliant

Hosted scene layers: These layers support fast map visualization of 3D data using a collection of cached tiles. 

Hosted image layers: These layers can display raster data by dynamically combining various bands, and they support the dynamic analysis of raster data such as imagery and other information captured by remote sensing devices. 

Hosted map image layers: This layer type is supported in ArcGIS Enterprise 10.8 and later

Mapping Styles:

Heat map: Displayers the relative density of points as smoothly varying sets of colors ranging from cool to hot.

Color and size: Using the symbol color and size to show one or two numeric fields

Compare A to B: Displayed the relationship between two numeric fields using ratio or percentage

Relationship: Visualizes the relationship between two number fields using bivariate choropleth mapping

Dot density: Uses dot density to display the distribution of one or more numeric fields

Predominant: Displayed the predominant category or level of predominance among two or more fields. 

Type and size: Represents the numeric fields by size and category fields by color 

Continuous timeline: Uses colors or sizes to represent data sequentially from new to old

Vector field: Uses direction and magnitude to display imagery data. 

This chapter also teaches us how to create a feature layer using geocoding, how to configure layer style using smart mapping, configure layer pop-ups using ArcGIS Arcade, and more. 

  • In 291, I think I did a map of all parcels in Delaware County selected that have 4 or more bedrooms so a salesman would know where to sell his pillows. I could now use a dot density map to target the neighborhoods with more people in them so he could have a wider variety of where people live. 

Gullatte week 1

Introduction: My name is Rheigna Gullatte and I am an environmental studies, geography major with a sociology minor. This is what I did this week. 

Poking around the website: 

  • I started exploring and clicked on community and forums. This is a cool little place where people can talk and post their findings about GIS related stuff. There is also a blog. When clicking my settings and my profile, it just has the basic necessities like every app or website does. 

Get Started: What is ArcGIS Online:

  • With this, you are able to create maps, apps, scenes, and even notebooks
  • With ArcGIS Online you are able to look at 2D and 3D maps and data. You can even share and collaborate with other people. It’s meant to be very accessible and you can even have this on your phone so you’re able to work in the field as well. 

Training: 

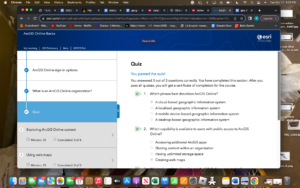
  • These are the two screenshots from basic training 
  • I learned that there are different access levels so everyone has a chance to use this software. 
  • I also learned that web scenes can show 3D geographic data
  • The other training I did was called GIS Basics. 
  • In GIS Basics, I learned that GIS is made up of five different components including hardware, software, data, people, and workflows.
  • Workflows can be used to improve efficiency by defining processes and repeatable tasks. 


Google Scholar:

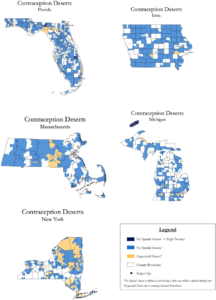
  • One of my keywords was “poverty”. I found an article called, “Contraception Deserts:The Effects of Title X Rule Changes on Access to Reproductive Health Care Resources”. The article is essentially about how access to contraception has been a struggle and supported in a bipartisan way. Title X is the main funding source for affordable reproductive care and it is simply not enough causing contraception deserts. 


  • I read the article “Forest Understory Monitoring Protocols for Stanley Park Ecology Society Vancouver BC”. My keyword was “weather”. The article is about the native plants and vegetation in the forest and how they are trying to save the plants from climate change and environmental stressors. 

Other:  I was in GIS 291 so I believe I completed the Delaware date inventory and know how to navigate around this account.