Brokaw final

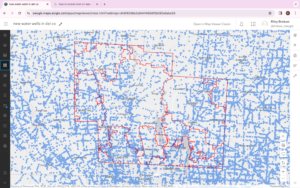
https://owugis.maps.arcgis.com/apps/mapviewer/index.html?webmap=d48f82d6a2e844f4958f5b265a9abe55

For my first application I created a map of Delaware County, OH and the zip codes within. I then used ArcGIS online to search for all water wells in Ohio. All of the blue dots are locations of water wells sites. I feel this application would be useful seeing how many people still use a well today or are reliant on city water.  

https://owugis.maps.arcgis.com/apps/webappbuilder/index.html?id=e49e6fc8084544b3ba7ae7202b161b8

For my 2nd application I used the ArcGIS Web AppBuilder to display an interactive web page display of Ohio and all oil and gas fields. Using the App builder and this theme you can search for an address or place, find the legend, filter, and also have directions from one location to another. I think an application like this would be useful for having to visit multiple locations in a short period of time.  The blue dot is  your current location and is a feature you can choose to add. 

Brokaw week 5

Chapter 7 was about building a 3D web scene.

Using Scan Viewer we are making architecture, construction and urban planning easier to visualize. 

Photorealistic – recreating reality using photos they use photos for these scenes because they are very good at showing texture and objects like a city.

Cartographic – makes a 2D thematic mapping into 3D. Using attribute symbols to show physical, abstract, or invisible features like population density, flight paths, solar impact, and zoning laws. 

They main elements in scenes:

  • Surfaces are continuous measurements of elevation with only one value for a location. Often referred to as digital models  DEM(elevation), DTM(terrain), DSM(surface). 
  • Features can be 2D or 3D and are live on, above, or below surfaces. Operational layers of 3D maps.
  • Textures are the exterior or interior 3D features. They use aerial imagery or cartographic symbols. 
  • Atmospheric effects are like fog and lightning. 

Brokaw week 4

Chapter 6: Spatiotemporal data and real-time GIS

Real-time GIS Basics 

  • Moving – airplanes, trains, cars. (anything that moves)
  • Discrete – earthquakes, criminal incidents. (things that ‘just happen”)
  • Stationary – weather station measurements, water levels at stream gauges, traffic speed, live video footage. (stands still but values change)
  • Change – perimeter of wildfires, flooded areas, urban sprawl. (change of growth)

IoT is a network of all physical objects with sensors embedded that will allow them to exchange data. An example would be smart cars and how they use IoT to connect with the geospatial cloud to find the best travel distance route and stay within traffic speeds. 

ArcGIS Velocity has new features like feed times that let users receive sensor inputs, real-time analytic items like processing and trigger alerts, and big data analytic items like historical observations. 

An application based on chapter 6 I would create is to find a map of OWU and create a layer with different events happening around campus for the week of November 13th – 17th. I would create a changing map to see how many students go to these events. Using spatiotemporal data I will collect this by using observational sensors. The duration of time will be stored in two fields for the start time of the event and the ending time. 


Brokaw week 3

Assign: Read and complete GTKWGIS Chapters 3 & 4 ArcGIS Experience Builder and ArcGIS Web AppBuilder. Create a new blog entry with comments, notes, and questions on these readings. 

Chapter 3 focused on the experience builder and you can configure the app without having to program. It is supposed to be flexible and help the user who needs more functions.  To create a web experience using experience builder you need to select a premade template or create one, add a theme, add source data, configure widgets, and refine the layout. 

Chapter 4 was more of how mobile webGIS can be used to benefit us than using a desktop version that had immobility, connectivity  issues. Mobile GIS is built on some technologies and has grown and invented new ideas. Some of those include wireless communication technology and the satellite internet services like the SpaceX Starlink plan. Others are mobile devices and mobile operating systems. Some mobile positioning technologies are Bluetooth, Wi-Fi, GPS, and GSM. 

Brokaw week 2

5 main types of content in Web ArcGIS

  • Data: supports data in many formats CVS, shapefiles, GPS Exchange Format, JavaScript Object Notation (GeoJSON), photos, imagery, geodatabases. 
  • Layers: Esri geospatial cloud hosts many layers including, feature layers, tilled layers, vector tiles, map image, image layers, scene layers, CSV layers, tables, and Open Geospatial Consortium, Web Map Services, web Map Tile Services, and web Feature Services. 
  • Web maps + scenes: web maps are 2D, scenes are 3D and they male up 1 or multiple layers + allow sophisticated layer configuration like style, pop-ups, access permission, and labels. 
  • Tools: Tools perform analytical functions like geocoding, routing, generating PDF files, summarizing data, finding hot spots, and analing proximity. 
  • Apps: GIS apps were made to work on mobile devices, desktops, and browsers. 

Main user types + privileges for the essential app bundle

  • Viewer→  can view items, can’t create, edit, share, or analyze items.
  • Storyteller → can create stories and express maps, can’t create other types of content.
  • Editor → can view and edit data, can’t analyze, create, or share items. 

Mapping styles 

  • Heat map → displays the relative density of points as smoothly varying sets of colors ranging from cool to hot 
  • Color and size → uses symbol color and size to show one or two numeric fields
  • Compare A to B → displays the relationship between 2 numeric fields using ratio or percentage
  • Relationship → Visualize the relationship between two number fields using bivariate choropleth mapping
  • Predominant → displays the predominant category or level of predominance among two or more fields.
  • Dot Density → uses dot density (and color) to display the distribution of one or more numeric fields. 
  • Type and Size → represents numeric fields by size and category fields by color.
  • Continuous timeline (color or size) → uses colors or sizes to represent data sequentially from new to old. 
  • Vector field → uses direction and magnitude to display imagery data. 

Include a few-sentence description of an application based on ideas from Chapters 1 & 2.

Over the summer I worked as an intern for a highway road and bridge project happening on the east side of Columbus . I would create an application to show the yard’s where material is being stored and the field offices and other storage trailers. I would make a feature of where the new road will cover and a feature for temporary roads, exits, etc. I would also add descriptions to the yards and what material is currently being stored at that location. I could also make a layer of pipe installed/ removed so it would be easier for foreman, operators, and labores to visualize so accidents can be prevented. Another feature could also be oil, gas, paint spills made on the job over the whole project just so either the city can have that information for their records and any clean up crews that might be needed after the project is finished. If we wanted information on safety around construction zones a layer could be made of accident reports and a description of the severity of the accident can be made whether that be workers or vehicle crashes. 


Brokaw week 1

Assign: Introduce yourself and indicate you did the stuff for this week. 

Hi! My name is Riley Brokaw and I’m a sophomore studying Environmental Science. I already had access to the OWU ArcGIS Online account from GEOG 291 last semester. 

Spend a few minutes poking around your account, including the icon in the upper-right corner, which takes you to your profile. Add your basic information to My Profile. Also, look at My Settings, My ESRI, Training, Community and Forums, ArcGIS Blog, and Help. Jot down two comments about what you find (for the blog entry for this Lab).

  • Some things I found while looking at my account were if you go to Community and Forums, creators can post a blog asking a question about an issue they ran into. It is cool that ESRI created a community for questions pertaining to this software.
  •  I also found in the ArcGIS Blog there are many articles on Mapping, Design and Planning that are open for anyone to read and gain more knowledge on a topic they are interested in. 

Use some ESRI resources to learn a bit about ArcGIS Online. Complete a read-through of Get Started: What Is ArcGIS Online. This should take about 30 minutes. Read through the different sections of this web page (stacked along the left of the page) and jot down two comments about what you find (for the blog entry for this Lab).

  • With a subscription to ArcGIS Online a learning community can be created with a select members for creating and exploring data all with an administrator managing/ organizing the environment. 
  • There is also a mobile app ‘ArcGIS Companion’ that makes it accessible for working out in the field. Being offline and being able to still create maps could save a lot of time for professionals. 

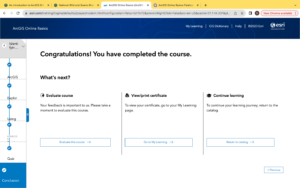
You also have access to ESRI courses online. Complete a free course that introduces you to ArcGIS Online.

  • I found that there are 3 different ways to add layers to a web map either ArcGIS Online, local files (use CVS or shapefiles), or sketch layers that can have descriptive information attached.  
  • After adding a data layer a neat feature ArcGIS will do is automatically add a symbol but if you decide to change it which is very easy the layer symbology will automatically update. 
  • Complete the Delaware Data Inventory (if you did not already do so in Geog 291). I completed this in GEOG 291!!Â