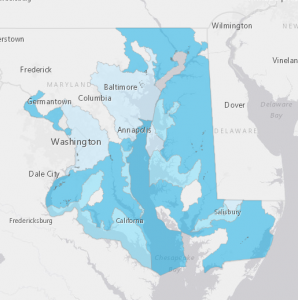
Application 1:
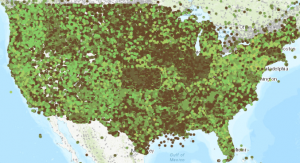
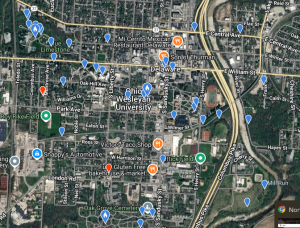
For my final, I created a map of Northern Cardinal sightings across the US using data from EBird. I was born in Atlanta, Georgia, and the Northern Cardinal is Georgia’s state bird, so I thought it would be interesting to see if the bird is just as common here in Ohio as it is in Georgia. The map of the US is all Northern Cardinal sightings, but I also wanted to focus on sightings on campus here in Delaware. I used a map to drop “hot spot” markers onto the campus, with data also collected with EBird.
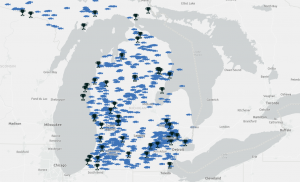
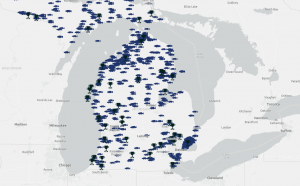
Application 2:
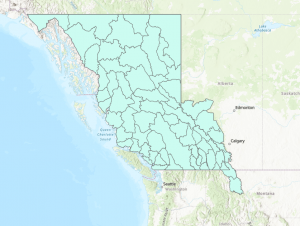
For my second application, I wanted to compare the number of largemouth vs smallmouth bass in Ohio. I struggled to find data for it, so I ended up settling on fishing data from the Great Lakes. I thought it was interesting that there was a lot more smallmouth compared to largemouth bass, which is also the case in most of the small lakes that I live by in Westerville. Generally, largemouth bass tend to be more plentiful in large bodies of water. (Dark blue=smallmouth, Light blue=largemouth)