McFarland Final

For my first app I created a story map with an interactive map of the Big Island Wilderness Area in the upper peninsula of Michigan. I took a trip there over the summer and created this to give a description of what the trip was like for any other fishermen considering the trip. This corresponds to the second chapter of the book on creating interactive story maps.

https://arcg.is/TOfCf

The second app that I created utilized the WebApp builder to create a 3d representation of the populations of each county in Ohio. This relates to the chapter 7 section on making 3d maps. The added bonus to it being made with the WebApp builder is that it has a cleaner presentation and can be more easily shared. Applications are broad for this app, but I made it with people who are considering moving to ohio in mind, and when moving to a new state people often take county population into account.

https://owugis.maps.arcgis.com/apps/webappviewer3d/index.html?id=ec26f7f24eed407782934ab95de1ddf9
 

McFarland Week 5

Chapter 7:

Two types of visual effects:

• Photorealistic: Aims to re-create reality using photos to texture features.
These types of scenes often use imagery as the texture and are extremely
well suited for showing visible objects, such as a city.
• Cartographic: Takes 2D thematic mapping techniques and moves them
into 3D. These types of scenes often use attribute-driven symbols (extrusion
height, size, color, and transparency) to display physical, abstract, or
invisible features such as population density, earthquake magnitudes, flight
paths, zoning laws, solar impact, and air corridor risks.

Four Types of Elements:

• Surfaces: Surfaces are continuous measurements, typically elevation,
with one value for a given x,y location. Surfaces provide the foundation for
draping other content.

• Features: Live on, above, or below the surfaces. They can be 2D layers
or 3D scene layers. These features are the operational layers of your 3D
app.
• Textures: Provide exterior or interior covers of your 3D features. Textures
often use aerial imagery or cartographic symbols.
• Atmospheric effects: Examples include lighting and fog.

VR: VR is a computer technology that uses headsets or multi-projected environments to
generate 3D views, sounds, and other sensations that simulate a user’s physical
presence in a virtual or imaginary environment.

X(extended)R(reality): XR refers to all real-and-virtual combined environments and human-machine
interactions, generated by computer technology and wearables, where the X
represents a variable for any current or future spatial computing technologies. (Includes AR)

McFarland Week 4

Chapter 6:

(Spatiotemopral data and real-time GIS)

loT = The network of physical objects, or things, embedded with sensors and network connectivity that emable these objects to collect and exchange data.

^ Think smart cities and homes

ArcGIS velocity allows use of feed items, real-time analytic items, and big data analytical items.

Poll methods = traditional approach in which a client peridocially polls the server to retrieve the latest data.

Push method = New way to serve data in near real time using the HTML5 Websocket Protocol.

McFarland Week 3

Chapter 3:

  • There are two types of widgets. Basic widgets are functional and perform as app tools. Layout widgets are used to organize basic widgets in pages or windows.
  • There are two categories of widget actions: Message actions listen to triggers and perform actions automatically, and Data actions provide users with a list of actions to perform that can all be selected.
  • It is exciting that there is an entirely different site, other than the app creator, that can be used to display information in a different way. I didn’t realize that ArcGIS Online was so diverse.

Chapter 4:

  • Mobile devices can be beneficial for pinpointing locations in the field.
  • Users can access through browsers, apps on their mobile devices, or a mixture of both.
  • The biggest benefit to using mobile devices alongside ArcGIS Online Apps is the use of location finders to have accurate location data in the field (especially in places where you can’t bring a computer to the field).
  • Unfortunately, the camera on my phone is broken so I wasn’t able to finish the tutorials for this section, but it seemed relatively simple.

Possible Applications:

  • Any situation where data needs to be taken in the field can find a use for the content of these chapters. Especially in situations where the data is location-specific.

McFarland Week 2

Chapter 1:

  • There are many common uses for ArcGIS Online, but most of them revolve around the fact that it is more accessable than the desktop version of ArcGIS because it requires less computing power and has a decreased cost, so it is much easier to share data cross-platform between many different individuals.
  • The basic components of a Web GIS app are basemaps (which provide a refrence for data), operational layers (layers that can be interacted with to fit the needs of a specific project), and tools (which perform tasks “beyond mapping” including query, geocoding, routing, and other specialized tasks).
  • The tutorial was very straightforward other than some discrepencies from the book to the newer version of the actual program.

Chapter 2:

  • Smart-mapping is an interesting concept of increasing efficiency when creating maps for a plethora of different kinds of mapping styles. I wish I had this for GEOG291 lol.
  • The basic outline of using Web GIS for storytelling consists of maps, a narrative for the reader to follow, and multimedia to create an “intuitive user experience”.
  • Step 7 of 2.2 asks to select the theme “above and below” but I can only chose either above or below, so I decided to just go with above and it doesn’t quite look right compared to the maps in the book.
  • Here is the link to my final story (https://arcg.is/9XaOm)

Possible Application:

  • A possible application from these chapters could be using using a possible telemetry system for an endangered animal and creating a presentation of maps and graphs convince a committee to allocate more funding for protection in areas that are essential for these animals well-being. Honestly, this could be very useful for anyone creating a presentation that includes maps as integration of these maps is seamless using ArcGIS Online.

McFarland Week 1

My name is Logan McFarland and I am a freshman who just finished GEOG291, so I am excited for this next GEOG!

Poking around my account:

  • When looking around the ESRI website I found myself looking at pricing for ArcGIS Pro and Wow it’s expensive! almost $800 for a professional basic bundle.
  • The training available is both interesting and very expansive covering many different kinds of topics.

Using ESRI Resources:

  • It seems like the online version of ArcGIS is more useful for sharing and analyzing maps than it is for actually creating them because creating them is more geared toward the desktop version of ArcGIS.
  • There are apps that can be used in the field that are useful for field workers who cannot take a computer out with them.

ESRI Training:

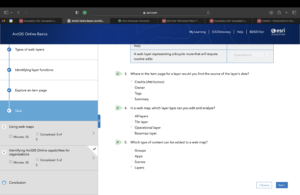
  • This course was eye opening to the many different uses of ArcGIS Online.
  • The quizzes were relatively easy and the step-by-step guide for the different sections was helpful.

Applications for ArcGIS Online:

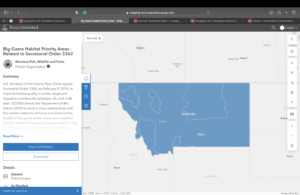
I did a similar application for GEOG291, but instead of trout fishing areas I decided to use big game hunting areas.

This map shows all of the big game hunting areas for the state of Wyoming.

A

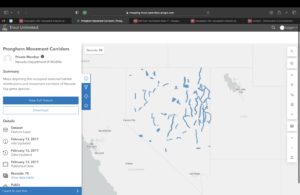
Another application that I found from the same organization, Trout Unlimited, was a map of the movement corridoors for pronghorn in Nevada. This is useful for both hunters and those concerned with the management of pronghorn populations, like government organizations, alike.