Campbell Week 7-8 (Final)

For the two apps I created I came up with my own data. The first, I used StoryMap to take viewers through my travels in Barcelona, Spain. The map has 8 different locations pinned, and for each location there is a picture and description corresponding to what was done/seen at that spot. The locations are in chronological order to when I visited them, and so if you scroll through the images or click on a number, it will take you to where I was located and what happened in that spot. I also have a line connecting all of the locations so viewers can more easily see the distance travelled and which order the locations were visited. To create this app, I used the Online Atlas to get a map of earth, then I zoomed into  Barcelona and locked that location so the map will stay in that spot. I then selected to pin different locations and added the pictures and descriptions to each location I created. This was a pretty straight forward process and I did not have a hard time creating this. I actually found it fun to do. This app corresponds to the second chapter of the GIS book. I’ve included images and a link to the app below.

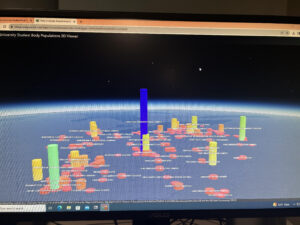
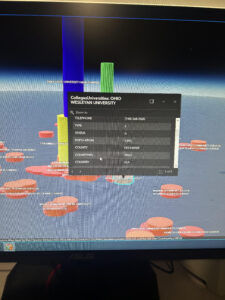
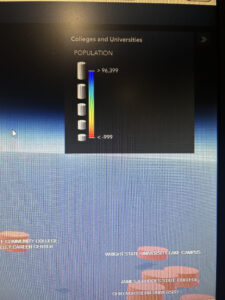
The second app I created was a 3D viewer of the student body populations at each university in Ohio. To do this I first created a web scene with a BaseMap featuring Ohio, then I used ArcGIS online and found a layer to add that included all Ohio Universities with their student body populations. Next, I changed the layer style to show a 3D count of the student body population of each college. You can individually click on each university to get the each number, or you can look at the bars and see which schools have the highest populations. The schools with the highest number of students will have the tallest bars with cooler or blue toned colors, and schools with less students will have smaller bars with warmer toned colors. I then used an Instant App to convert the scene into a 3D viewer Web App. I also found this process pretty straight forward. This app corresponds to chapter 7 in the book. I have included a few pictures of the app and a link below.

https://owugis.maps.arcgis.com/apps/instant/3dviewer/index.html?appid=c81f529af9954cf69f29f117af350e95

https://storymaps.arcgis.com/stories/7bf9546d573a479dbb52d2eb847222ad
 

Campbell Week 5

  • 3D web maps are called web scenes or 3D scenes in ArcGIS. It brings an extra dimension to 2D maps, and so it provides advantages in data visualization, analysis, and communication. It allows audiences to quickly understand the size and relative position of objects. It also enables designers to build flexible scenarios quickly and effectively while avoiding costly mistakes. 
  • Just as web map can have many layers, a web scene can also have multiple layers. These include feature layers, map image layers, image layers, raster tile layers, vector tile layers, and scene layers. Based on visual effects scenes can be grouped into two main types: photorealistic and cartographic. 
  • Photorealistic layers aims to recreate reality using photos to texture features. These types of scenes are good for demonstrating visible objects like a city. 
  • Cartographic layers takes 2D thematic mapping techniques and moves them into 3D. These layers are good for attribute driven symbols such as height, color, transparency, etc. or for invisible features such as population density, flight paths, solar impact, etc. 
  • The main elements in scenes: 1.) surfaces- continuous measurements with one value for a given x,y location. They are often referred to as a digital elevation model (DEM), digital terrain model (DTM), or digital surface model (DSM). 2.) features- live on, above, or below the surfaces. They can be 2D or 3D and they are operational layers. 3.) textures- provide exterior or interior covers of your 3D features. Textures often use aerial imageries or cartographic symbols. 4.) atmospheric effects- examples include lighting and fog
  • 3D object scene layers- used to represent and visualize 3D objects, such as textured or untextured buildings. Can be created manually or automatically. 
  • Building scene layers- allow you to visualize complex digital methods of buildings and interact with all components of the building. You can explore a building’s composition, properties, and locations of structures in a building’s digital model. A 3D building scene layer has the following structure: 1.) overview- optional layer that allows you to view the 3D building as a singular layer. 2.) discipline- combines category layers into various work disciplines of the building such as architectural, structural, mechanical, etc. 3.) category layer- represents individual categories such as windows or walls organized in disciplines. They are 3D object scene layers. 4.) filter- allows you to view details in complex buildings. 5.) integrated mesh scene layers- constructed from large sets of overlapping imagery. It will turn raw, still imagery into valuable information products. It can identify matching points on different images and stitch the images together based on these points. 6.) point cloud scene layers- provide a fast display of large volumes of symbolized point and cloud data. 7.) point scene layers- used to display large amounts of point data not possible with a point feature layer. This ensures fast visualization for clients. These layers are automatically thinned to improve performance and visibility at smaller scales. As you zoom in, additional features are displayed. 8.) voxel scene layers- represents multidimensional spatial and temporal information in a 3D volumetric visualization. You can visualize atmospheric or oceanic data or space -time cubes as voxel layers. 
  • ArcGis Pro- a desktop app that provides comprehensive tools for managing 2D and 3D data, and authoring and sharing 2D maps and 3D scenes 
  • ArcGIS CityEngine- a desktop app that provides advanced 3D creation capabilities.
  • ArcGIS Online and ArcGIS Enterprise- Web GIS platforms that can host scene layers for online and on-premises 3D web GIS apps, offer Scene Viewer for creating and viewing web scenes, manage the access to web scenes and related layers, and provide ArcGIS Experience Builder and other ready to use apps.
  • VR- a computer technology that uses headsets or multiprojected environments to generate 3D views, sounds, and other sensations that stimulate a user’s physical presence in a visual or imaginary environment. VR can immerse users and scenes generated from GIS data. ArcGIS 360 VR is a web app that allows you to view 360 VR experiences on desktop PCs, mobile devices, and VR headsets.
  • XR- refers to all real and virtual combined environments and human machine interactions, generated by computer technology and wearables. It includes AR,VR, and MR. MR is the merging of real world and virtual worlds to produce new environments and visualizations, where physical and digital objects coexist and interact in real time. 
  • Metaverse- a network of 3D virtual worlds focused on social connection.. GIS can produce 3D scenes of the world’s terrain, digital cities, airports, office buildings, etc. 
  • ArcGIS Indoors and ArcGIS Pro- allow you to create and manage data and share maps and services to support other apps. It guides GIS professionals through the process of creating the indoors geodatabase. 
  • ArcGIS Indoors Viewer- allows you to find a location or resource within a building or a site that includes several buildings. 
  • Indoor Space Planner- A browser- based app that allows you to plan occupant activity in indoor spaces. Including assigning individuals to specific locations or activity based work.
  • ArcGIS Indoors for iOS and Android- allow you to view indoor maps and interact with them by exploring, searching, saving, sharing, getting directions, etc. 
  • I could create a web scene to see the student population of all the universities in Ohio. Prospective university students could use this to get a visual representation of how many students they would be surrounded by in deciding the size of school they would like to go to. To do this, I would add the state of Ohio as the first layer, and then continue layering with all of the universities in Ohio with their student body population as the main attribute to visualize. The schools with higher populations will appear higher elevated than smaller schools. The schools would also appear to be located in the relative area of the actual school on the Ohio map.

Campbell Week 4

WEEK 4

  • Spatiotemporal data can be categorized into the following groups: moving (lives feeds of airplanes, buses, cars, trains, etc.), discrete (criminal incidents, earthquakes, geotagged social media feeds), stationary (wind speed and direction measurements at weather stations, highway and traffic speed, water levels at stream gauges), and change (perimeters of wildfires, flooded areas, land use and cover) 
  • Real time GIS handles current and continuous data, which can be the latest position, speed, altitude, direction,  temperature, pressure, concentration, or water level of various sensors and other objects. It can provide better situational awareness, enhance emergency response, and support decision making. 
  • Point in time- refers to time values that are typically stored in a single attributes field (lightning strike)
  • Duration of time- refers to time values that are typically stored in two fields, one for the start time and the other for end time. (wildfires)
  • Time measurement systems- time can be expressed in many units, such as in years, months, days, hours, minutes, and seconds
  • Time reference systems- time zones and rules for daylight savings time (GMT, UTC) 
  • Time representations- how the date and time is written (11/07/2023)
  • Temporal resolution- refers to the time interval in which events are sampled (weather report stations report temp. Every 15 mins) smaller temporal intervals will result in larger data sizes and larger temporal intervals will result in lower temporal resolution
  • IoT is the network of physical objects embedded with sensors and network connectivity that enable these objects to collect and exchange data. Enterprise IoT applications include smart cities, infrastructure management, environment quality monitoring, etc. Consumer IoT applications include connected cars, connected health, and smart homes
  • ArcGIS Analytics for IoT and GeoEvent Server share similar basic components: 1.) Ingest- interacts with various data sources. It provides ways to communicate with IoT platforms, sensor networks, social networks, etc. 2.) process- this component processes real time data received and translated by the ingestion component. It also uses real-time filters that remove events that do not satisfy specified criteria. 3.) outputs- sends processed data to a variety of destinations. 
  • ArcGIS Analyitics is a real-time and big data processing and analysis capability of ArcGIS Online. It includes the following: 1.) feed items- allow users to receive sensor inputs. 2.) real time analytic items- allow users to perform real-time processing of these inputs. 3.) big data analytic items- allows users to access and analyze big data repositories of historical observations. 
  • Poll and Push methods: 1.) Poll- the traditional approach in which a client periodically polls the server to retrieve the latest data. 2.) Push- the new way to serve data in near real time using the HTML5 WebSocket Protocol. 
  • Using the information provided in Ch. 6, I could create an app to illustrate the student body population change over time at OWU. To do this, I would find records of the student body population for each year, then enter that data into a file and upload it. I would then add the title, tags, and ensure that the correct time zone is selected and the PopDate is recognized as a Date field and a Time Field. I would then animate the time-series data so that an illustration demonstrates the rise/fall patterns of student enrollment at OWU up to 2023. This could be useful for OWU enrollment staff to see trends on attendance at the school, and to help enhance the methods the school uses to promote students to come and stay here. It may also be interesting for prospective students to see the trends of the school as well. 

Campbell Week 3


  • WebAppBuilder and Experience Builder are intuitive what-you-see-is-what-you-get builders that allow you to create 2D and 3D web apps without writing a single line of code. They share a similar workflow for creating web apps and they have the following key features: they create pure HTML and JavaScript apps that are cross platform, they use responsive web design technologies to create web apps that work well on desktops, tablets, and smartphones, they include numerous out-of-the-box widgets that can be flexibly remixed and configured, they include a collection of configurable themes or templates so you can customize the look and feel of the apps, and they provide extensible frameworks for developers to create custom widgets, themes, or templates. 
  • These aspects are ONLY available through Experience Builder: provides flexible layouts so you can build apps that are map centric or non-mapcentric and can display them on a fixed or scrolling screen and on single or multiple pages, it was built with a mobile-first design, it can integrate both 2D and 3D content within one app, and it adds action triggers so you can make a widget respond according to actions that the other widget performs. 
  • Widgets are typically JavaScript or HTML components that encapsulate a set of focused functions. They can be categorized into two groups: Data-independent widgets- Basemap Gallery, Measurement, and Draw widgets are not related to the operational data layers and need little to no configuration. The other group is Data dependent widgets- Query and Chart widgets are related to specific attribute fields of specific layers within the app. They often require detailed configuration.
  • Mobile GIS refers to GIS for use on mobile devices and has the following advantages: Mobility, Location awareness, ease of data collection, near-real-time information, Large volume of users, and versatile means of communication. 
  • Mobile GIS is built on the following technologies: mobile devices such as smartphones and tablets, mobile operating systems (abdroid, IOS, microsoft), wireless communication technology such as bluetooth and wi-fi, and positioning technology like GPS and other approaches. 
  • Mobile GIS is related to many popular types of apps and frontiers, including LBS, VGI, VR, and AR
  • description of an application: The town I am from, Portsmouth, Ohio, had a flood in 1937. I would create a web map of the areas of my city that were affected by flood waters. This would mostly be for history buffs interested in the history of Portsmouth, and for them to see a visual representation of what the city looked like while it was flooded. To do this, I would use Web AppBuilder and upload a map of Portsmouth, Ohio. I would then add some data-dependent widgets and so if someone wanted to hover over a specific building in Portsmouth, the height of the flood water at that specific building would pop up as well as the exact day corresponding to that measurement.

Campbell Week 2

  • There are 5 main types of content: data,layers,tools,web maps and scenes, and apps. Data can publish web layers; web layers can create web maps and web scenes; web maps and scenes and web tools can be used in apps or to create apps. 
  • Today’s best practices suggest that a GIS app have basemaps, operational layers, and tools: Basemaps- provide reference or context to your map. You can use a 2d or 3d basemap, and most of the time you do not need to create a basemap to use one. However you are also able to create and use your own basemaps. Operational layers- these are theme layers that you and other users can use an interact with. Layers span in a range of subjects and can support maps and apps of almost every subject. Again, you do not necessarily need to create your own operational layers to use them. Tools- these perform tasks beyond mapping including query, geocoding, routing, and other specialized tasks.
  • There are 3 basic tiers in WEB architecture and the generic workflow to build web GIS apps: 1.) the data tier contains formats that range from simple CSV files to more sophisticated geodatabases. This allows you to author GIS data, maps, toolboxes, and scenes. 2.) the middle tier allows you to publish desktop resources to ArcGIS Online or ArcGIS Enterprise as web layers and tools. You can add the layers to web maps and web scenes and configures the styles and popups in these scenes. 3.) the client tier consists of various ready to use apps or custom apps. 
  • I studied abroad in Spain this past summer. I had the opportunity to visit the city of Barcelona and see many attractions. I would create an application of the places I visited in Barcelona by starting out with a basemap of the city of Barcelona, then I would create  a featured layer with geotagged photos of me in these specific locations. Next, I would add fields to the feature layer and edit the attributes so I can add descriptions and context to each location I visited. Next, I would add my feature layer into the Map Viewer to configure its style and pop-up before finally using the Attachment Viewer to transform my web map into a web app.

Lauren Campbell Week 1

My name is Lauren Campbell and I am a senior. I plan to graduate in December but recently discovered I was .33 units short of the 34 unit requirement, so I am taking this course so I can graduate! This will be an interesting learning experience for me.

  1. Spend a few minutes poking around your account: 
  • Under “My ESRI,” it says I need an invitation from my ESRI administrator.
  • There are many different training options for the platform, some of which take multiple days (even weeks!) to complete!

2.Use some ESRI resources to learn a bit about ArcGIS Online. Complete a read-through of Get Started: What Is ArcGIS Online.

  • I think map viewer is a cool concept. Especially because it creates interactive maps and provides real-time updates as you work.
  • You can create 3D scenes with accurate distances between two points, generate elevation profiles, change the daylight and weather in the scene, add multiple layers, and include basemaps. This all sounds very complex!

3. Complete a free course that introduces you to ArcGIS Online. 


4. Look into a few GIS application areas. Include, in the blog posting, information on two applications with at least one map or image and a source or two.

  • The first map demonstrates gender identity and sexual orientation and is owned by Dianaclavery_uo. This layer shows the percent of adults who are LGBT as well as adults whose gender and sexual orientation are not listed on the survey. The color and size of the symbol depicts the percentage and the size depicts the count.
  •  Source:  Household Pulse Survey Data Tables. Data values in this layer are from Week 34 (July 21 – August 2, 2021), the first week that gender identity and sexual orientation questions were part of this survey. Top 15 metros are based on total population and are the same 15 metros available for all Household Pulse Data Tables.

  • I also looked at research called “Music and Place” by Tyler Brown. This person was interested in finding out if references to place in pop music affect our perception of the United States. Their findings suggested that the places most referenced in pop music do not align with where most Americans live, and that more research would be needed to definitively conclude anything else.