Luna – Week 9 (Final Apps)

App 1: https://owugis.maps.arcgis.com/apps/instant/interactivelegend/index.html?appid=90dab0ef6a2746b295872c46d09f7f01&locale=en-US

For my first application, I chose to make an interactive experience with Instant App. In this application, users can do one of two things: click on a point or click on the legend. When the user clicks on a point, it reveals the address and land use type. When they click on a land use type in the legend, however, the map will highlight any properties that are for that specific land use. This application is very simple, but could be used to help in city planning.


App 2: https://experience.arcgis.com/experience/2940cc7c85cb4f338376b2e7c2ffe35c/

For my second application, I found myself, once again, gravitating towards the address data from the Delaware Data. To make it a little different this time, I used Experience Builder to add a few widgets to the map. In this app, users can still click on a point to see the address and land use, but they can do a few more things. To begin with, they can search for an address and get information that way. They can also see the pie chart widget that I added to see the different proportions of zip codes, which is something that was not really included in my first app.

Luna – Week 6

Chapter 7

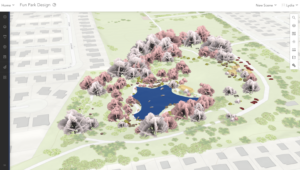
Application: This could be used to visualize the different natural elements that can be seen around Delaware. While it is not as effective with how many buildings there are in Delaware County, but with parks or other places like that, this could be really useful.

Luna – Week 5

Chapter 6

Application: This could be used in many ways with Delaware Data. My first thought would be to use it in the same general way using crime data. This could also be used with any other activity or information because it can show all different aspects of a data table.

Luna – Week 4

Chapter 3

Chapter 4

Application: I think that both of these chapters can be used in different ways. I think that the widgets could be used to create a more interactive map of Delaware. The surveys, on the other hand, could be used to collect information and possible direct people that are newer to Delaware.

Luna – Week 3

Chapter 1

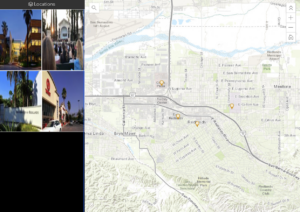
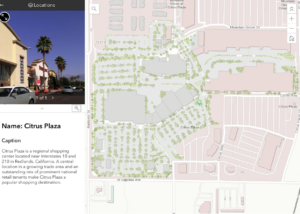
Application: These functions could be used to make an interactive map for someone that has never visited Delaware before. In order to do it, I would need data about locations in Delaware that may be visitor-friendly and pictures of each of the locations. With that information, I could make a map like this one that could be used as a visitor guide.

Chapter 2

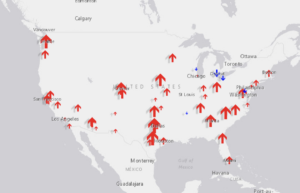
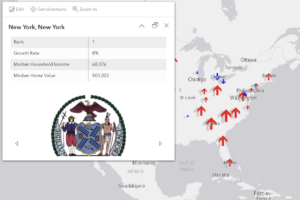
Application: This could be used in a very similar way: to show populations in counties in Ohio. This would require data on all counties, including past data in order to show growth, but would be a possible and useful way to use this chapter.

Luna – Week 1

Hi! My name is Lydia and I am an Environmental Science major!

Account Comments

  • I did not have a bio so I added where I go to school and what my major is.
  • I did not know about the trainings that were offered and I think that it’s interesting that they seem to know that their program can be complicated but are willing to offer programs to help with the confusion.

Get Started Guide Comments

  • After doing Desktop GIS at the beginning of the semester, I think it’s very helpful that Web GIS allows for some more collaborative work because while I appreciate the way that I need to individually learn the skills for assignments, the work can sometimes be tedious, so collaboration could be very beneficial in the future.
  • I also think that it’s constructive that ArcGIS has many platforms that can all be used for one project.

Training Comments and Screenshots

  • This training really made me look at the ways that GIS can be used and the reasons why different levels of privacy are useful in different situations.
  • I also found this training useful because it pointed out the locations of the basic functions that were different from ArcGIS Pro.

Articles

  • A Web-Based GIS Waste Data Management System (Claudia Attard and Sergio Tartaglia): using Web GIS to track waste management and the systems regarding it
  • Web-mapping of environmental pollution of the surface waters of the Lviv region (Sohor A.R., Fys M.M., Brydun A.M., Sohor M.A.): using Web GIS to observe surface water pollution

Data Inventory

  • I already completed this during GEOG 191 🙂