Adjei Final

In this course

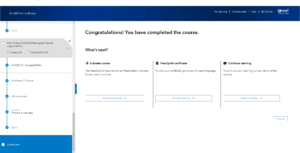
My first application was built on the skills I acquired in Chapter 2 of the smart mapping unit. Within this application, I displayed the gdp per capita for each county in Ohio. My interest in economics fueled my choice of this specific data set.

https://owugis.maps.arcgis.com/home/item.html?id=c2ac9bf71d7c403982eb222dfd6c2fea

My second app was built upon the skills I learned in the previous chapter on web scenes. I created a dynamic 3D map that visualized the growth of wholesale versus retail trade specifically within the state of Ohio.

https://owugis.maps.arcgis.com/home/item.html?id=5ab7f3709fbf44999b1a86d0a83b820b
Adjei Week 5

Reading notes:


  • Introduction to 3D mapping within GIS through web scenes, emphasizing the importance of scene layers like photorealistic and cartographic types.
    • In-depth exploration of various scene layers such as 3D object scene layers, building scene layers, integrated mesh scene layers, point cloud scene layers, point scene layers, and voxel scene layers.
  • Broader applications of 3D GIS are explored, spanning urban planning, architecture, engineering, construction (AEC), virtual reality (VR), augmented reality (AR), extended reality (XR), and the emerging metaverse concept.
  • Significance of indoor 3D GIS highlighted, with ArcGIS Indoors serving as a solution for smart building management, providing wayfinding for people, assets, and specific rooms.


In my application, I would use spatial analysis to identify economic disparities across different regions within a state based on its gdp data. Using techniques such as integrated mesh scenes to pinpoint areas with economic growth or those with economic challenges.

Adjei Week 4

This chapter focuses on the significance of real-time GIS, especially in the context of data generated by mobile devices, sensor networks, smart cities, and the IoT. It introduces ArcGIS products like ArcGIS Velocity, ArcGIS Dashboards, and ArcGIS Mission for addressing real-time data challenges.

Key terms related to spatiotemporal data and IoT are discussed, emphasizing their role in various applications, including smart cities and smart homes.

ArcGIS Velocity, a SaaS platform on ArcGIS Online, is introduced for real-time and big data analytics. ArcGIS Dashboards provide real-time monitoring capabilities in law enforcement, environmental protection, and social media analysis.

ArcGIS Mission is a real-time geospatial communications and situational awareness product for emergency response and security operations.

Using new techniques from this chapter, I could respond to changes in the job market by collecting real-time job-related data and using ArcGIS Velocity to process the data. I would also employ real-time analytics to identify trends and correlations.

Adjei Week 3

These two chapters provide a comprehensive introduction to modern applications, with a particular focus on Mobile GIS. The first chapter emphasizes the features of the Experience Builder, such as basic and layer widgets.

The second chapter takes us into the idea for Mobile GIS. This chapter explores the advantages of Mobile GIS, such as mobility and real-time information. It introduces various Esri mobile apps, including ArcGIS Field Maps, Survey123, QuickCapture, and AuGeo, tailored for different data collection purposes. Additionally, it covers important concepts like Location-Based Services (LBS), Volunteered Geographic Information (VGI), Virtual Reality (VR), and Augmented Reality (AR) within the context of mobile GIS.


Week 2

Reading notes:


  • Web GIS serves as a central database with a global reach, providing a cost-effective solution for users. Its primary purpose is to facilitate data analysis.


  • Web GIS consists of five main types of content: data layers tools web maps + scenes and apps. 


  • Data can be used to publish web layers; web layers can be used to create web maps and web scenes; web maps and scenes and web tools can be used in apps or to create apps


In my application, I would aim to analyze the potential of a specific place of interest by visualizing job growth over time. To achieve this, utilizing relevant data, through the use of color or size, I will represent the progression from new to old job opportunities, allowing insight into the area’s economic development


Adjei Week 1

Hello, my name is Josh, and I’m from Maryland. For this week’s assignment, I needed to learn how to access my OWU ArcGIS account. Upon gaining access to my account, I was welcomed by a dashboard displaying the school’s campus maps below. At the top of the screen, I noticed several indexes, including Groups, Content, Organization, and more. Digging deeper, I discovered training resources, such as tutorials on how to master ArcGIS. These tutorials are available in the form of written guides or instructional videos that you can access.


screen shot from web course: