Fondran Final

Final two applications

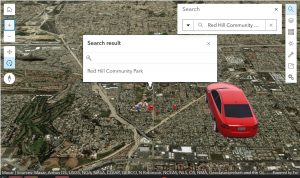
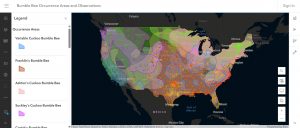
1.For my first application I was inspired by the chapter 4 tutorial on Survey123. As I’ve walked around campus, I have noticed that wildlife is abundant in this area. This made me want to create a survey where users could select the wildlife they spotted and put the exact location where it was seen. Users could also select the date it was spotted and even add pictures with their response.  This would allow for easier reporting of animals and understanding where they frequent the most.  This could be helpful for people who may want to avoid areas with skunks or areas where deer populations are higher, prompting more caution when driving.

https://arcg.is/0zSuzO

2.

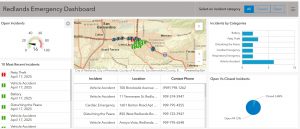
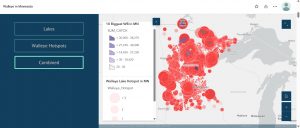
This first application leads me into the second, where I’m applying the data from the survey and making it easier for the public to view. Rather than just keeping data for myself, I wanted to create an interface where people could see the real-time data. I used information from chapter 6 tutorials to create a comprehensive dashboard that uses data from my Wildlife Reporting survey. I created data from the survey into a feature layer by making it into a map scene. I then opened up a dashboard and almost exactly followed the tutorials from the book. I ran into a few problems but was able to move past them, creating an informative dashboard. The dashboard includes a gauge to show the number of wild animal sightings in the last 10 days, the 10 most recent sightings and what they were,  the frequency of what animals have been spotted over the last month, and also a map with pinpoints of exactly locations. The survey and the dashboard will be published so that everyone can collaborate on it whether or not they’re in our organization.

https://owugis.maps.arcgis.com/home/item.html?id=9a3aaab2f19843edbca04647a2da2220

Data used:

Topographic map  of Delaware County from ArcOnline

“Fake” data from the Survey in order to show how the dashboard would look/function

Fondran Week 2

(I thought this was posted already but it never did so I am rewriting it now)

Chapter 1:

This chapter had similarities to what I did in Geog 291, but was different since it is applied to ArcOnline. I started strong but quickly got confused when trying to upload the Redlands data. As I continued, I was able to familiarize myself with each of the tools and discovered there is a lot you can do. I think this chapter was well explained, but lacked some necessary pictures, I felt I needed to better understand what I was doing. As I navigated through 1.4 I ran into another issue, I was unable to complete step 11. I could not find the “select layer field of sort by”; anytime I clicked where it would be, it disappeared. I reviewed other students’ maps in our organization to see what they looked like since mine did not end up looking as it should.

Chapter 2:

For chapter 2 it focused on Smart mapping and storytelling with GIS. The first tutorial was to create a feature layer using geocoding. I had to download the data from the main website onto an external drive. The tutorials were relatively easy compared to the first chapter. In tutorial 2.2 I was able to stylize all of the needed arrows and colors however it didn’t look quite right. I ran into another problem in the third tutorial when trying to use expressions to calculate things. Towards the end of the chapter we created a story about US population change. I had trouble stylizing some things in the story but I believe it looks as it should. I didn’t run into very many problems in the last tutorial the chapter. Overall, the story i created conveyed the proper message asked by the book.

Application:

An application could be made about the population change in Delaware. I’ve heard from many people that Delaware has quickly became a very populated area in a short amount of time. I could create a story map showing how many people have moved here within the last ten years and where they chose to within the city.


Fondran Week 5

Chapter 7:

This chapter focused on 3D web scenes and what I found interesting was the metaverse. Specifically, the book mentioned Fortnite, a game I love to play as an application of the aspects of the metaverse. As I created the first map scene it started to become illegible even though I was following the steps from the book. Since it was not looking correct I changed a few things around; For tutorial 7.2, I changed km to inches for Pop. Per sq. Mi. to visualize the population data. This may be because the data set referenced in the book may not have been the same as mine or it has been updated since the book’s publication. Tutorial 7.3 posed a bit of a challenge since I was not in the right “‘Red Hills Community Park” luckily I was able to find it once i started to realize! I ran into another problem after finding the park…For some reason the car attribute must be attached to the wrong data or I missed a sizing step when symbolizing. Even though I ran into this problem, this chapter was really fun and I enjoyed making a fun park.


Application:

Ohio Wesleyan could gather data of everything on campus to make a public web scene for anyone to access. This could be used by students to find certain buildings or amenities on campus. New students and visitors could use this as an easier way to orient themselves when trying to tour the campus; allowing for a better transition and positive tour experience. Our campus is pretty small but buildings like Sanborn or the soccer field are not directly on campus and with a web scene you can discover all the extra spaces on campus you might not know are there.

Fondran Week 4

Chapter 6:

This chapter was interesting, and I enjoyed creating the Redlands Emergency Dashboard. It focused on spatiotemporal data and real-time GIS, two things I had not heard of before. The introduction was a great way to move into the tutorials and made everything easier to understand. It was interesting to see how you can get real time data, such as emergency calls and highway camera pictures. I can see how something like this system could be very beneficial for communities to track crime and see which areas could be underserved. I had a few problems with tutorials 6.4 and 6.6 because some of the buttons were hard to find. Overall, I enjoyed this chapter and learned more important aspects of the dashboard feature.

An application from this chapter on other data could be used for weather. Temperature gauges around the city of Delaware could relay the most up-to-date temperatures to the dashboard. This would allow people to dress or prepare accordingly to a more accurate temperature than their phone.

Fondran Week 3

Chapter 3:

This chapter was pretty straightforward and quite fun. I always love the assignments where we can make something that we can publish. I ran into a problem during 3.3 and ended up having to skip most of the chapter since I could not figure it out. It was nice to learn another important part of online GIS work and how it can convey such important information.

Chapter 4:

This chapter was interesting because we got to learn a new skill by making a survey. I also found it interesting how GIS has adapted to the changes we are experiencing with the increased use of devices. I also thought a lot about how much I use Apple Maps on my phone and how each of our lives run on GIS. I found tutorial 4.7 to be the most interesting because of how cool the QuickCapture app is. Overall, this chapter covered many important aspects of mobile GIS.

Application:

The Survey123 feature could be used for such a wide variety of things. I think that this could be applied to monitoring invasive species such as garlic mustard. Since there is so many options for inserts I could insert choice questions, map, file upload, and email to make data collection easier.  People in the Delaware County area can provide where, how much, if they tried to remove it, and any other information. This could promote community involvement in removing these species thus eradicating them easier.

Fondran Week 1

Hi I am Jade and I’m a sophomore studying zoology and minoring in environmental science.

I have previously taken Geog 291 and have some experience using ArcOnline. I began by going through my profile and then went and looked around the rest of the website. The training section was interesting since it listed different courses you can take for free. These courses are made to help people gain better skills pertaining to GIS. Next, I went into the ArcGis Blog and it included many articles about ArcGIS and helpful tips for users.

The Introduction page was a great overview of ArcOnline and I was able to learn so much more about it. With ArcOnline you can share and collaborate on projects with people in and out of your organization. You can share maps or other content by embedding them into web pages or social media. It was helpful to learn that you can also create maps that will be used offline and set it up so that offline editors get updates.

The Introduction course consisted of new and some old skills that I learned in GEOG 291. Some of my previous knowledge was able to help me get through a little quicker than if I had never seen this before. I really liked this training module because it explained each step very well and made you think critically during each lesson. I enjoyed learning how to create a new map and use data from online sources as we did with the snow routes in the Sierra Nevada. Additionally, I also learned about different sharing levels for different purposes including private, group, organization, and public. The module did a good job at explaining the differences between each and when you would use different levels.

For my first search I searched “ArcOnline Bumble Bees”. I found an application that was looking at the occurrence areas and observations of bumble bees in the United States. This map was very detailed and interesting to look into. It had each species of bumble bee and where they are most prevalently seen.

https://www.arcgis.com/apps/mapviewer/index.html?webmap=97296dc461714d60b5459ecc8fafdd41

Search 2:

For my second search I looked up “ArcOnline Walleye”. I don’t fish but this is just what popped into my head first for some reason. What came up was a very cool website that shows fisherman where hotspots are for walleye in Minnesota for free!  I thought this was such a cool idea and very fitting since Minnesotans are considered to be  some of the nicest citizens in the US! The website included pictures of different spots, sum catch, confidence level, and other fun facts. If anyone is ever taking a fishing trip to Minnesota definitely check out this website.