Munroe Week 9 (Final)

https://arcg.is/1yLrqP

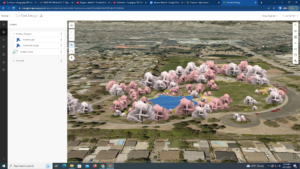
The first application I created was a StoryMap highlighting the former houses in Delaware that served as Greek life houses. This has interested me for a while, and I compiled all the addresses from the OWU archives last school year. I created an application in the StoryMap where viewers can click on the addresses and see pictures and information I’ve compiled on the history of the houses. I’ve already sent this to Nancy Rutkowski, and she’s archived it with the alumni office.

https://owugis.maps.arcgis.com/apps/instant/countdown/index.html?appid=6d4ff170990f4d5c82c1127d512a121a&locale=en

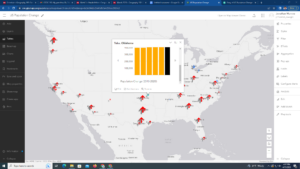
For my second application, I created an instant app using configure countdown. The data I used came from a course I took last year, GEOG112, with Dr. Krygier. I made an app that shows the top 10 counties in Missouri with the highest population decrease. I went back into the web map I created last year, switched up the symbology, and created popups with line graphs depicting the population decline. The only thing I couldn’t get to transfer over to the app was the rounding of percentages, so the percentages are very long in the popups compared to what I had before.

Munroe Week 6

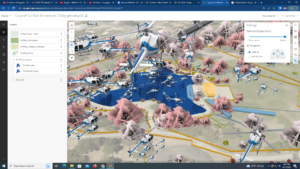
Chapter 7: 3D Web Scenes

Main elements in 3D scenes

  • Surfaces: Continuous measurements, typically elevation, with one value for a given x,y location
  • Features: On, above or below surfaces. Operational layers
  • Textures: Exterior or interior covers of 3D features
  • Atmospheric effects: Ex. lighting and fog

Web scene layers

  • 3D object scene layers
  • Building scene layers
  • Category layers
  • Filter
  • Integrated mesh scene layers
  • Point cloud scene layers
  • Point scene layers
  • Voxel scene layers

Munroe Week 5

Chapter 6: Spatiotemporal data and real-time GIS

ArcGIS Velocity and GeoEvent Server

  • Ingest: Provides ways to communicate with IoT platforms, sensor networks, social network feeds and other real-time data streams
  • Process: Processes the real-time data received and translated by the ingestion component
  • Output: Sends processed data to a variety of destinations, including writing to a data store, sending data to web clients, alerts through SMS/email

New ArcGIS Velocity Items

  • Feed items
  • Real-time analytic items
  • Big data analytic items

Munroe Week 4

Chapter 3: ArcGIS Experience Builder

Editions of Experience Builder

  • Embedded in ArcGIS Online
  • Embedded in Portal for ArcGIS
  • Developer edition

Widgets

  • Basic Widgets: Functional and can perform as app tools
  • Layout Widgets: Help organize widgets on pages or windows
  • Message Actions: Listen to triggers and perform actions automatically
  • Data Actions: Provide an actions button that users can click in widgets at runtime and select from a list of actions to perform
  • Triggers: Events generated by the source widget
  • Targets: Perform actions responding to the trigger
  • Actions: Specific business logic that the targets perform

https://experience.arcgis.com/experience/8291f9325ace4e2e8652b02dec691471/

Chapter 4: Mobile GIS

Mobile GIS Concepts and Advantages:

  • Mobility
  • Location Awareness
  • Ease of data collection
  • Near-real-time information
  • Large volume of users
  • Versatile means of communication
  • Built on mobile devices, mobile operating systems, wireless communication technologies, and positioning technologies

Munroe Week 3

Chapter 1: Get started with Web GIS

Objectives:

  • Grasp the concept and advantages of Web GIS
    • Global reach, large number of users, low cost per user, better cross-platform abilities, easy to use and maintain
  • Understand the deployment patterns of Web GIS
    • Esri managed and customer managed
  • Learn the components of the new-generation of Web GIS
    • Portal which represents a gateway for accessing all spatial products in an organization. Helps to organize, secure and facilitate access to products
  • Understand the technical evolutions and trends in Web GIS
    • From closed websites to open geospatial web services
    • From one-way to two-way information flow
    • Portal technology is becoming essential
    • Cloud GIS delivers GIS functionality and ready-to-use contents
    • Mobile is becoming the pervasive Web GIS client platform
    • Map visualization goes from 2D to 3D and virtual reality
    • Data source goes from static to real time and spatiotemporal big data
    • Web GIS is becoming more intelligent
  • Understand the concepts of web services and hosted feature layers
    • Main content types: Data, layers, web maps and scenes, tools and apps
    • Hosted layers refer to a situation in which a web service is based on ArcGIS managed data, stored in the ArcGIS Online cloud database or in ArcGIS Data Store
  • Publish hosted feature layers from CSV files
  • Learn the workflow for creating web maps and web apps
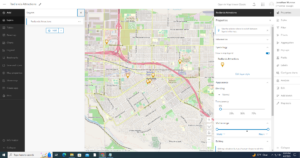
Example Application: A map, like the tutorial, showing locations of former fraternity and sorority houses in the historic Northwest neighborhood of Delaware. Images (PNG) and text from the Delaware Historical Society for each house and possibly alumni quotes.


Chapter 2: Smart Mapping and Storytelling with GIS

Types of hosted feature layers:

  • Hosted feature layers
  • Hosted Web Feature Service (WFS) layers
  • Hosted tile layers
  • Hosted vector tile layers
  • Hosted Web Map Tile Service (WMTS) layers
  • Hosted scene layers
  • Hosted image layers
  • Hosted map image layers

ArcGIS Living Atlas of the World

  • Dynamic collection of layers, maps, tools and apps produced by Esri and thousands of contributors

StoryMaps

  • Storytelling (used this so many times for Ashley Allen’s classes and other final projects)
Link to StoryMap: https://arcg.is/1L5D1u0

Example Application: Interactive StoryMap visualizing the population change/decline in Newfoundland and Labrador fishing cities.

Munroe Week 1

Hi! My name is Jonathan Munroe. I’m a junior from St. Louis, Missouri majoring in geography and minoring in music performance.

I already completed the first few steps in this week’s posting during the last course and have had an Arc account since freshman year. Two things I noticed when looking through my account were:

  • I didn’t have a bio. I decided to create a brief bio including my hometown and major/minor.
  • I went through all my old projects to review what I’ve completed in the past. I had forgotten how many storymaps I’ve made through the years, creating projects for Urban Geography, Geography of Pop Culture, Science Behind Climate Change, Cultural Geography, and The Power of Maps and GIS.

Two things I learned from Get Started: What is ArcGIS Online

  • Slides. I learned that slides let you capture the state of the scene. This is helpful when needing to tell a story through your map, especially when needing to show the difference between factors like camera position, daylight settings, etc. To do this, click slides on the designer toolbar, click capture slide, name it and hit save. This will capture the scene of your map at this moment, and allow you to return to it as it has been successfully saved. 
  • Floor-aware maps. These maps contain GIS data from inside buildings and organize it into floor-aware layers, good for visualizing indoor spatial data. To do this, click map properties on the contents toolbar and find the indoor layers section. From there, turn on enable floor filtering and select the layers that correspond. You can also specify additional line, point or polygon feature layers. Click save and it will be added to the map.

Training Course

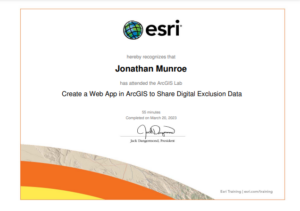
  • I already completed the web course for ArcGIS Online Basics so I found a course titled Create a Web App in ArcGIS to Share Digital Exclusion Data. This course utilized ArcPro and ArcOnline to show how the two programs work together. Two things I learned were:
    • How to utilize pop-ups with graphs to better display data for specific counties
    • How to create and apply web apps onto my online maps.

Two Articles:

  • Yolanda F Wiersma and Randolph Skinner: Predictive distribution model for the boreal felt lichen Erioderma pedicellatum in Newfoundland, Canada
  • This application took forestry data from Newfoundland and information regarding boreal felt lichen habitat suitability and applied it together to create a map highlighting the expanse of where this species would grow in Newfoundland

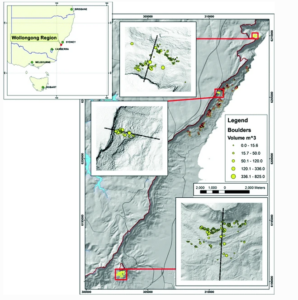
  • Phil Flentje, Darshika Palamakumbure, Jack Thompson: Assessing Rockfall Along the Illawarra Escarpment
  • This application mapped rockfall data from the Illawarra Escarpment surrounding Wollongong, where I studied abroad in the fall semester, using 2D and 3D modeling.