Powell Week 4

Chapter 6

This chapter focused on explaining how to create a dashboard web app and looked at spatiotemporal data and real-time GIS.  I vaguely knew of what these terms mean but I still always think it is so crazy how easy it is now to get real-time data.  I always find it interesting to see how GIS can be found in real life settings and events.  In the first half of this chapter it goes over how to create a dashboard that shows 911 calls along with incident reports.  I found the way this information was laid about to be very engaging but I did find it a little overwhelming as I was having issues with sizing the map.  The rest of this chapter was easy to follow and showed how to create a time-enabled feature layer along with how to animate time-series data.

For this chapter I think for this I would want to make an application that involves creating a dashboard to look at specific crime incidents in Delaware.

Powell Week 3

Chapter 3

This chapter looked into ArcGIS Experience Builder and how it is a highly configurable app.  The first section of this tutorial (3.1) took a look at how to use Experience Builder to create a web app that can display historical earthquakes and hurricanes in 2D and 3D maps.  I found these instructions to be vey straightforward and it was interesting to see the comparison.  I really liked how specific each function was and found this to be a useful tool and my only main issue was with finding where specific things that the instructions were leading you to as I think the layout of the overall app has changed and I think some of the stuff required you to select something for it to show up.  It wasn’t hard to figure it out it was just annoying that these instructions weren’t as straightforward considering that everything else has been easy to follow.

Chapter 4  

This chapter looked into Mobile GIS and I found it interesting how it was saying that the Survey123 can be used to recognize specific things such as leaves or street signs.  The first part of this chapter focused on explaining how to create a survey which was super easy to follow and reminded me a lot of Google Forms.  The app was a little bit unnecessary to download as you could just get the link from the QR code provided to test the survey.  Survey123 seemed like a good way to collect to data and I liked the way the data was laid out.  I had some issues with the app as it kept crashing but that might just be my phone.  I thought it was interesting overall to see just how much we are moving towards data collection on smart devices rather then the traditional data collection through computers which is interesting because it just means that collecting data is going to become more accessible and easier to do and maybe possibly even more accurate.

Based on these ideas I think this could be used in Delaware to report specific incidents by using Survey123 which could be linked to a map so that people are aware of where incidents occur.

Powell Week 2

Chapter 1

The first chapter went over the basic concepts of Web GIS and looks at some of the tools available.  I found these instructions to be very clear and found that it showed a good idea of the basics of what Web GIS has to offer.  The pictures shown in these tutorials were very easy to follow and were super helpful by being a guide to make sure that I am in the correct place for the steps.

Chapter 2

This chapter looked more into different types of layers along with the concept of story telling in Web GIS.  This chapter was easy to follow as a lot of it were things I had previously seen throughout the first half of this class (GEOG 291).  I felt as though creating the layers was very similar on Web GIS as it was on the Desktop version (ARCGIS) which was nice as I was familiar with the content.  When it came to tutorial 2-3 I was having some issues with getting it to work as but overall everything else was pretty easy to follow.

An application based on ideas from Chapters 1 & 2 could be looking at the use of mapping to see the specific attributes of the population that is impacted by Delaware being a food desert.

Powell Week 1

Hi, My name is Jes Powell and I am from the Cayman Islands.  I am currently a senior and doing a major in Studio Art.  

For Week 1 the first thing I did was look around my ArcGIS Online account which I was already semi familiar with as I took GEOG 291 during the first half of this semester.  I looked at My Settings, ESRI, Training, Community and Forums, ArcGISBlog and Help which I had already seen some of these from the previous section of this class when one of the tutorials required us to create something on the website.

When doing a read-through of Get Started: What is ArcGIS Online it was pretty basic and standard information.  It laid out the basics for using ArcGIS Online along with what it is useful for.      

The training course, ArcGIS Online Basics was easy to follow through and had a visualization of the information presented which made it easier to understand.  The quizzes were also easy to do and were placed in a way that made it easier to recap each section which was useful.  

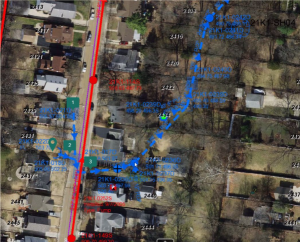
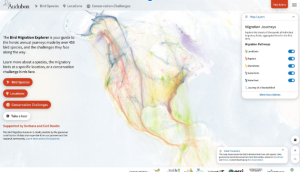
The last thing I had to do for this week was to go on Google Scholar and look at something based on my own personal interests.  I started with doing a general search of GIS applications related to birds and found an article on a Bird Migration and how ArcGIS online was used to create a story map that provides information on bird migration through animation maps that show the routes of different species of birds.  My second search was related to the population of stray cats in specific areas which led me to an ArcGIS online story map which was not related to stray cats. It was still interesting as it took a look at how GIS was used to save their cat.  They used GIS to look at the map of sewer networks and stormwater lines and used it to map where they needed to be to get their cat.


Source:

https://www.esri.com/arcgis-blog/products/story-maps/mapping/telling-the-story-of-bird-migration

https://explorer.audubon.org/explore/species/1469/american-white-pelican/migration?sidebar=collapse&selectedHex=&zoom=3&x=-787128.6037500007&y=2377104.4919&range=0.0350%2C0.0550

<https://storymaps.com/stories/fa56126cacc641c6bde9562ac7b2a7cb>