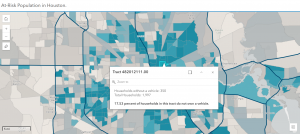
Real-time GIS and spatiotemporal data are used to track and visualize changes over time and space. The types of data this explored are moving data (like moving objects), discrete data (specific events like weather), stationary data (fixed objects with changing aspects), change data (shifts over time). This allows us to look at trends from the past or real time data. A few of the things included in the tutorial were the living atlas, dashboard creation, arcade scripting, data categorization, time series data, and population changes. I found these tutorials interesting and applications could be interesting too. One thing I thought of is that I mobile ordered at starbucks last week and the line was super long so the drink wasn’t ready when it said it was. An application of this could be real time data about how many orders they are working on or how many people are waiting.
Author: jenorman
Norman Week 3
ArcGIS Experience Builder and Mobile GIS are powerful tools for creating and interacting with geospatial content across platforms. Experience Builder enables users to design customizable, mobile-friendly web experiences with drag-and-drop and widgets for 2D and 3D data. It integrates with ArcGIS Online, ArcGIS Enterprise, and the ArcGIS API for JavaScript. Mobile GIS extends GIS capabilities to portable devices like smartphones and tablets, enabling realtime data access, updates, and fieldwork through apps like ArcGIS Field Maps, though smaller screens can limit detail. I thought Chapters 3 and 4 were a little bit more difficult, but also not as interesting as the previous ones. I ran into a few issues, but moved past them fairly easily. There could be several different applications for the features in these chapters because interactive tools like surveys can genuinely be used in any field and make things get mapped more easily.
Norman Week 2
The first chapter discusses applications of Web GIS in different fields and how its use is increasingly valuable in different scientific fields, businesses, governments, etc. People also use these types of applications in everyday life. Having this software on the Web makes data and different features more accessible. The tutorials were fairly easy and showed how to upload data, add fields, and add feature layers.
The second chapter has six tutorials and goes more in depth looking at feature layers and different ways that you can format maps to best display your data. These tutorials were definitely more challenging than the first chapter, but I didn’t have too much trouble with it. I think the software is very cool and I love the incorporation of all the different base maps and data.
I think I would like to do something with economic data since I am a politics and economics major. I think looking at employment data could be interesting.
Norman Week 1
oduction:
I think that the ArcGIS living atlas of the world is a really interesting tool. I played around with it a little bit and it was cool. I also like the incorporation of using different web layers in your maps.
Tutorial:
I found the tutorial fairly easy except for some features were a little different than they were described. It didn’t really trip me up thought. I thought it was a good overview of how to use the software and I feel like I will be able to use it successfully. The basics mostly seem pretty intiuitve.

GIS Uses:
I looked at uses of GIS in transportation planning, which is something I am interested in. I found a few interesting uses including traffic flow managment. It also helps with public transit planning in analyzing things like population density, planners can determine where stops and transit sites should be. Another way it can help with transit planning is through route optimization.