Kozak Final

The first application I chose was to create an App that shows seven of the most popular ski mountains in NH. I included basic data and photos for each resort.

https://owugis.maps.arcgis.com/apps/instant/attachmentviewer/index.html?appid=ddaef4ae018d4e889a9c497585547370


The second application I chose was to make a map of the United States showing the median household income per county.

https://arcg.is/WX4L90


Kozak Week 5

Chapter 7

Chapter 7 is about web scenes. It discusses how using 3D can aid in data visualization, analysis, and communication. This helps create a range in storytelling, urban planning, architectural design, defense simulation, filmmaking, and other industries. The chapter then talks about web screens and how they can be grouped into two main groups: Photorealistic and cartographic. The main elements in scenes are surfaces, features, textures, and atmospheric effects. Scenes layers include these types: 3D object acne layers, building scene layers, overview, discipline, category layer, and filters, integrated mesh scene layers, point cloud scene layers, point scene layers, and voxel scene layers. There are several different ways to create 3D products in ArcGIS including using ArcGIS Pro, ArcGIS CityEngine, ArcGIS online, and ArcGIS Enterprise. 

The chapter then discusses VR, XR, and the metaverse. VR is a computer technology that uses headsets or projected environments to create a 3D scene, often accompanied by sounds and other sensations. XR is all real-and-virtual combined environments. It includes AR, VR, and MR. The metaverse is a collection of 3D virtual worlds that put a focus on social connection. GIS plays an important role in helping to build the metaverse. There are several ways ArcGIS has been moved “indoors”. It can help manage indoor space utilization, indoor emergency response, security deployment, and more. Lastly this chapter discusses ArcGIS Urban and ArcGIS GeoBIM. ArcGIS Urban applies GIS technology to urban planning. It consists of three main parts, a public web app, back-office web app, and a CityEngine. ArcGIS GeoBIM bridges the gap between GIS and BIM (Building information modeling).

One idea for this chapter would be to create a thematic web scene of the average income per household in each state. I think it would be interesting to see the different income levels represented as height.

Kozak Week 4

Chapter 5: 

Chapter 5 is about caching and on-premises(private) web GIS. One may need a private WebGIS for security, connectivity, or functionality. In order to create a private WebGIS, one can use ArcGIS Enterprise which includes a portal for ArcGIS, ArcGIS server, ArcGIS web adapter, and an ArcGIS Data Store. These different components work together to provide the best private network service. This chapter then discusses portal collaboration and the hierarchical structure of organizations. These organizations can share information with each other using groups, and Web GIS deployments are accomplished by using distributed collaboration. This helps to effectively organize, share, and network across organizations. 

The chapter then gets into raster tile, vector tile, map image layers, feature tiles, and publishing strategy. Raster tiles deliver maps to client applications as image files that are prerendered and stored on the server. Vector tile layers deliver map data as many grouped vector files, usually in PBF. Map image layers are used for visualizing operational layers and are drawn dynamically by the server or by using tiles from a cache. Feature services are used to generate feature tiles when requested by ArcGIS client apps. These feature tiles enable web clients to display more features from the service and provide a faster load time. Publishing strategy is a term for selecting an appropriate layer type for your data.

The chapter then discusses web services standards. Standards specify the interface that different vendors can use and are important in achieving interoperability among vendors. It specifies the parameters, values, and results. OGC is the main standard body and has defined a set of standards for Web GIS services. The last section of chapter 5 is about workflow to share web layers from ArcGIS Pro. This section talks about publishing web layers by using ArcGIS pro. This is done in three main steps:

  1. Preparing the data using ArcGIS Pro
  2. Authoring the map in ArcGIS pro by adding data layers to the map and configuring layer symbols and other properties
  3. Sharing the web layer

Chapter 6:

Chapter six is about spatiotemporal data and real-time GIS. Spatiotemporal data can come from many different sources  and includes observations of objects and events that move or change through time . It can be split into several groups including moving, discrete, stationary, and change. 

  • Moving→ something that moves
  • Discrete → something that just happens
  • Stationary→ stands still but values change
  • Change→ change or growth

The time value of an event can be a point in time (values are typically stored in a single attribute field) or duration of time (values are typically stored in two fields, one for the start time and the other for the end time). IoT is a network of physical objects that are embedded with sensors and network connectivity that enable objects to collect and exchange data. Some included devices are airplanes, security cameras, and refrigerators. Geolocation provides context to the sensor data collected in the IoT ecosystem. It can transform raw data into information that can be used. Smart city is a popular app that uses connected sensors to supply information that assists a city in managing assets and resources. Smart homes often involve using wifi connected sensors and AI to help control a home. This can include Amazon Echo, smart thermostats, automatic lights, and geofences. 

The next main section of focus is on cloud, server, and client-side technologies for real-time GIS. ArcGIS Velocity and ArcGIS GeoEvent Server can connect to multiple forms of streaming data to perform data processing and analysis. It can also send updates and alerts when prompted. Both of the programs are able to collect, process, and store high-volume- and high velocity real-time data that is generated by the IoT. ArcGIS Velocity has a few newer types of items including feed items, real-time analytic items, and big data analytic items. 

Another product talked about in this chapter is ArcGIS Mission. It provides managers, analysts, and responders with a comprehensive picture of the operating environment. It ultimately helps with the coordination of movement, and communication among team members. The three main components are Mission Manager, Mission Responder, and Mission Server. 

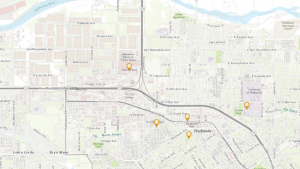
One possible application that I could make based off of chapter 6 is to create a dashboard web app for the Grafton County Dispatch in Central NH that coordinates fire and EMS response from the included towns. This app could show 911 reports, incidents, and categories of calls per county and per town. It would help visual emergency response in rural areas and show what calls are the most frequent. This could help with future training based on call volume.

Kozak Week 3

Chapter 3: ArcGIS Experience Builder

Chapter 3 is about ArcGIS experience builder and how you can use this to have more functions than an individually configurable app and be able to remix functions of multiple apps. Experience Builder has pre-made widgets that provide functions like mapping, table view, querying, charting, and reporting. You can then select, mix, and configure these widgets to enhance your apps. To create Web experiences using Experience Builder the user must pick a premade template or start from scratch, select a theme, add source data, add and configure widgets, refine layouts for all devices, save, preview, publish, and then share. There are two main types of widgets, basic and layout. Basic widgets include map, legend, layers, query, filter, edit, chart, elevation profile, and survey while layout widgets include section, column, row, fixed panel, and sidebar. This chapter talks about the three versions of Experience builder and how they are similar and different to each other. The tutorial for chapter three went over how to create a 2D and 3D integrated web experience, configure map message actions, configure dynamic content, configure the table widget, configure the filter and chart widgets, and create and navigate multiple pages. 


Chapter 4: Mobile GIS

Chapter four goes over the functionality and purpose of mobile GIS. Mobile GIS has several advantages over desktop GIS including mobility, location awareness, ease of data collection, near-real-time information, large amounts of users, and versatile means of communication. This chapter discusses how mobility has a big advantage overall but can be limited by a device’s CPU speed, memory, etc. People can use mobile GIS for a large array of things like finding somewhere to eat, learning how to get somewhere, field surveys, and parcel delivery. The chapter then talks about feature layers, and feature layer views which allow users to view different sets of information. A feature layer may also contain a feature template which defines the type of data items that users can add to a layer. There are several notable approaches to mobile app development. These include browser-based, native based, and hybrid based. ArcGIS field maps is a newer program that supports planning, tracking, understanding, and data capture phases of field workflow. ArcGIS indoors is a mapping system that understands the location and activities within an indoor setting. It can help users feel more connected to a workplace or campus and is seen to boost productivity and collaboration. This chapter also provides details on several other mobile GIS applications that users find helpful. The tutorial includes exercises that go over Survey123, Field Maps, Quick capture, and AuGeo. 


One interesting application would be an app that people could report moose sightings in NH for population survey purposes. Moose populations in NH are threatened and I think it could be helpful to ecologists to have a database of moose sightings to help get a better understanding of species abundance in a given area.

Kozak Week 2

Chapter 1

Chapter 1 is used to introduce ArcGIS online and ArcGIS Enterprise and the basic operations of the program. Web GIS uses web technologies to allow people to interact globally and access information instantly. Some of the advantages of Web GIS are global reach, large numbers of users, low cost per user, better cross-platform capabilities, easy usage, and easy maintenance. There are five main content types available with Web GIS including data, layers, web maps and scenes, tools, and maps. There are three main components that make up a Web GIS map and they include the basemaps, the operational layers, and the tools.

Chapter 2

Chapter 2 is about smart mapping and storytelling. Stories are the most popular type of web apps. This chapter talks about the different types of hosted layers, including hosted feature layers, hosted WFS layers, hosted tile layers, hosted vector tile layers, hosted WMTS layers, hosted scene layers, hosted image layers, and hosted map image layers. There are several different ways to publish hosted layers including creating a feature layer from your own data, creating a feature layer from an existing template, and creating an empty feature layer and defining your own fields. This chapter also talks about smart mapping which enables people to analyze, create, and share maps quickly. Smart mapping can also perform exploratory data analysis which helps people understand potentially hidden patterns. Pop ups are used to show geographic data and insight. A good WebGIS app is fast, easy, and fun for the user. An ArcGIS story tells the who, what, when, where, and why. It uses a combination of maps, narrative, and multimedia to create a story. 

One potential application would be to create a map of the most popular ski mountains in NH. The map would display location as well as information like mountain height, average number of visitors per year, and mileage of ski trails. The information would also include images of the ski mountain or logo to help familiarize the audience.

Kozak Week 1

My name is Halle Kozak, I am a senior majoring in Zoology and Botany. I already did 291 the first half of the semester. I read the syllabus and schedule, took the quiz and scheduled the required meetings with Dr. Krygier. In my account I explored my profile and the other tabs. I found out that you can see different posts from community members regarding ArcGIS online, and I saw all of the different settings I can apply to my account.

What is ArcGIS online:

  1.  ArcGIS allows you to explore and visualize 2D and 3D data. It also allows you to share personal maps, work collaboratively to create maps, scenes, apps, and notebooks, and access analysis tools to better understand your data. 
  2.  One interesting/important point that this webpage includes is how to create a map on ArcGIS online. The steps include choosing a basemap, adding layers, applying styles, configuring popups, and saving the map. In GEOG291 we learned how to do all of this using ArcGIS. 

ArcGIS online basics

This course taught an overview of ArcGIS online. One thing that I learned was that an ArcGIS online organization is a virtual space within the ArcGIS Online cloud that enables an organization to manage content and foster collaboration. Users with organizational access can participate in groups and share work with other members of the organization. I also learned that there are seven types of operational and basemap layers. These include feature, tile, map image, imagery, elevation, scene, and table. Operational and basemap layers are used to classify layers based on their use or how their data is structured. 

Applications

The first application that I chose is from a paper titled “Influence of landscape heterogeneity on the functional connectivity of Allegheny woodrats (Neotoma magister) in Virginia”. The map shows the locations of rock habitats trapped for Allegany woodrats in Virginia. 

Citation: Kanine, J. M., Kierepka, E. M., Castleberry, S. B., Mengak, M. T., Nibbelink, N. P., & Glenn, T. C. (2018). Influence of landscape heterogeneity on the functional connectivity of Allegheny woodrats (Neotoma magister) in Virginia. Conservation Genetics, 19(5), 1259-1268.

The second application I chose is from a paper titled “ Predicting habitat suitability of the critically endangered Be’er Sheva fringe-fingered lizard”. This map shows the binary habitat suitability using the species distribution model for Acanthodactylus beershebensis. 

Citation: Horesh, S. J., & Ovadia, O. (2024). Predicting habitat suitability of the critically endangered Be’er Sheva fringe‐fingered lizard. Ecology and Evolution, 14(8), e70108.