Wagner Week 4

Chapter 5 was about caching and on-premises Web GIS. I learned about the need for on-premises and hybrid Web GIS, Arc GIS enterprise components and deployment, and portal collaboration. ArcGIS Enterprise is a variation of ArcGIS online that has four components: a portal for ArcGIS, an ArcGIS server, ArcGIS Web adapter, and ArcGIS Data Store. Portal collaboration is interesting and seems very effective for organizations to work together. I then read about raster tile, vector tile, map image layers, feature tiles, and publishing strategy. 

Chapter 6 was about spatiotemporal data and real-time GIS. Real-time GIS is used for objects and events that move, appear, and change through time. Spatiotemporal data can be categorized into: moving, discrete, stationary, and change. The time value of the data can either be a point in time or a duration of time. ArcGIS  Velocity and ArcGIS GeoEvent Server can connect to many kinds of streaming data, perform continuous data processing and analysis, and send updates and alerts when specific conditions occur in real time. This is amazing to me and I can think of so many applications that could use these. It then went more in depth about ArcGIS velocity and GeoEvent Server and then ArcGIS  Mission. 

I could create an application to show the population change of Delaware over time. I could get the data for the population over time and animate the data with a time slider then create a web app. 

Wagner Week 3

In chapter 3, I learned about ArcGIS Experience Builder. I learned the basics of experience builder and some of its key features. The web apps that are created using the experience builder are called web experiences. After learning about the basics, I started tutorial 3 to create a web experience that displays data about historical earthquakes and hurricanes. First I created a 2D and 3D integrated web experience. There were a few steps that I had to google where the buttons were but other than that, it went smoothly. Next, I configured map message actions. Then I configured dynamic content, the table widget, and the filter and chart widgets. Last, I added two pages. When I was adding the link to the second page, it said it only supports HTTPS so it wouldn’t work. I just moved on. Overall, I enjoyed this tutorial and I see how this type of app can really help show data and make connections.

Chapter 4 was all about mobile GIS. I learned about the concepts and advantages of mobile GIS such as mobility and ease of data collection. I also learned about field maps which allows users to display web maps, search for places and features, such as assets or areas of study, and be directed to them. In tutorial 4, I learned to use Survey123, Field Maps, QuickCapture, and AuGeo. While doing 4.1 and adding a map, I couldn’t find the imagery hybrid basemap. I also could not figure out how to set the rule for step 14. In the end, the survey still worked fine. In 4.3 I couldn’t find the create a list button for step 15 and so I wasn’t able to complete the rest of the tutorial. This created a problem for the next several tutorials but I am still going to try and figure them out. It was interesting to download and use the apps on my phone when I had no idea GIS could connect to things like that. I thought AuGeo was a cool project as well.

An application I could create would use experience builder to show crimes in a specific area. I could have the 2D and 3D maps and show data that shows the different types and amount of crimes. I could add other pages with additional information about the location and maybe a website with resources on how to report a crime or stay safe. 

Wagner Week 2

In chapter 1 I learned about the basic concepts and advantages of Web GIS. The thing that I really love about web GIS is that the content can be shared with so many people around the globe. Web GIS has so many ways for people to collaborate and get a deeper insight into data. I also hadn’t thought about how the government would use web GIS. This chapter also went over the evolution of web GIS which was interesting. I’m excited about the apps in web GIS, especially the storymaps.

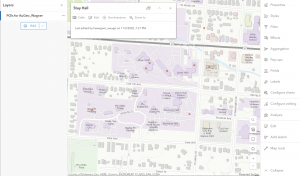
For tutorial 1, I created a web GIS app to show the main attractions in Redlands, California. I first created a feature layer from a CSV file and added attachments to it. I then added a field to my layer and edited the attributes. Next I created a web map and configured its style and pop ups. I didn’t struggle too much but GIS always takes me a while. Finally I turned my web map into a web app. 


In chapter 2 I learned about smart mapping and storytelling with GIS through the use of story maps. This chapter focused on hosted feature layers which support vector feature querying, visualization, and editing. A lot of information about smart mapping and styling I already know about thanks to GEOG291. I remember making a story map in that class as well. 

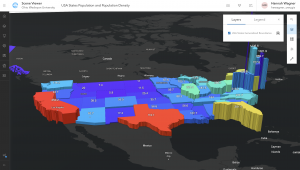
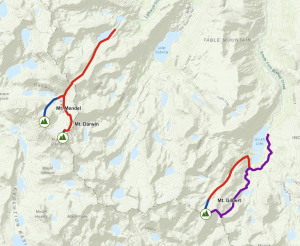
In tutorial 2, I learned how to create an app that presents the spatial patterns of US population change, explore the reasons behind the patterns, and share what I found with the public using a StoryMaps story. I first created a feature layer using geocoding. Then I configured layer style using smart mapping. Next I configured layer pop ups using ArcGIS Arcade. When trying to add an expression I was pretty confused but I guess it worked out. Then I added images and charts, created a story, and worked with swipe blocks and express maps. I really enjoy making storymaps and web GIS makes it pretty easy to do. 


I think it would be fun to make a map using the attachment viewer to show important buildings on campus or attractions in Delaware. It would be helpful for future students to see the locations as well as pictures and captions of different academic/housing buildings around campus. It would also be helpful for students or people to see popular spots in Delaware to visit. 

Wagner Week 1

Hi! My name is Hannah Wagner and I am a sophomore majoring in Environmental Science. I have taken the quiz and scheduled an appointment for weeks 2 and 3.

I first looked through some of the basic stuff in my account. I found the community and forums to be really interesting and I would like to explore some of the posts. I also liked the training section that had a lot of different courses to help navigate and use ArcGIS online.

I then read through  “Get Started: What Is ArcGIS Online” and all of the different sections.  I found that you can work collaboratively with others to build maps, scenes, apps, and notebooks and then share your work with others. Another thing that caught my attention was scenes and the fact that you can add weather effects to them.

I then completed the ArcGIS Online Basics web course. I enjoyed this course and the information it gave me. I learned about all the different layer types. I also thought it was cool that there are many different sharing options to control who has access to your organization’s content. Two trainings that interest me are ArcGIS Online: Editing Essentials and 3D Visualization Essentials.

Here is the map that I worked with and my certificate from completing the training.

I already used Google Scholar to look into GIS applications in GEOG291.