Jolliff Week 2

Chapter 1&2

Chapter 1 was really kind of an introduction into ArcGIS. Some basic history, what it is used for, and how we can apply it. This is mostly a recap of things I learned in GEOG 291. However, this is help to re-visit. the frame work to Web GIS apps was interesting to read about. I found it interesting about the different way you can set up an app. Chapter two about smart mapping and storytelling was interesting. Introducing map layers was good so thatĀ  you can see what the building block of web apps are.

An app idea that think would be interesting to explore would be an app that shows interactive maps that show photos of specific places. In particular I think a map that shows images of the different parks around where I live would be interesting. Seeing as there is not a whole lot of advertisingĀ  for the parks around where i live this would be a way people could look at the parks and see if it was something they would be interested.
Jolliff Week 1

My name is Hazel Jolliff I am a Junior and I took GEOG 291 before spring break so I have a bit of an idea of how ArcGIS works. I found it interesting to go through the online course and see how ArcGIS online works. I thought it was cool that you can make groups and organizations. I think that it is helpful to be able to share things . it was a good refresher about base maps and operational layers, I had almost forgotten about those.


My Searches:


#1. My search was ā€œ GISā€ and ā€œCrop Damageā€

Reference: Lou, W., Ji, Z., Sun, K., & Zhou, J. (2013). Application of remote sensing and GIS for assessing economic loss caused by frost damage to tea plantations. Precision Agriculture, 14(6), 606–620. https://doi-org.owu.idm.oclc.org/10.1007/s11119-013-9318-5


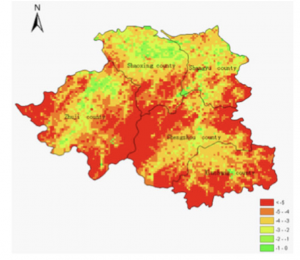
The article titledĀ  ā€œApplication of remote sensing and GIS for assessing economic loss caused by frost damage to tea plantationsā€Ā  focused on developingĀ  a way to determine economic loss due to spring frost in tea plantations. The map used remote sensing and GIS to form a spatial distribution of temperatures in the given production area.


#2. My search was ā€œ GIS Applicationā€ and ā€œArchaeologyā€


Reference: Ebert, D. (2004). Applications of Archaeological GIS. Canadian Journal of Archaeology, 28(2), 319–341.


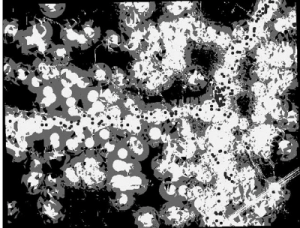
The journal was titled ā€œ Applications of Archaeological GISā€. This is an example of a predictive model, the dark circles represent existing sites that were used to base