Week 8 Final – Godsey

Application 1: https://arcg.is/1GibeH0

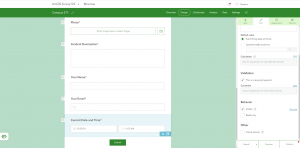
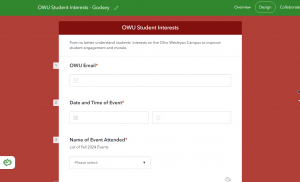
For the final project, I created a smart Survey123 form to better understand students’ interests on the Ohio Wesleyan Campus and improve student engagement and morale. The survey had 7-8 questions about the students and the events they attended. The first question prompts the student to enter their OWU email address to ensure the results come from currently enrolled students. The second question asks for the date and time of the event they attended to make sure the event was real and registered. I then added a list of OWU’s events in the fall of 2024, which could be updated for every semester and year. I also included another option for fraternities/sororities/club events that only appears when selecting other. For example, if selecting other under event attended, the student will be prompted to choose the type of event (fraternity event, sorority event, academic event, cultural event, special interest event, etc.), which will then show a list of every club in each section (ex. under cultural events it lists all the cultural clubs such as horizons which host culture fest). Then, the student is prompted with four questions regarding the event (how they heard about it, what they liked/disliked, and comments/suggestions).
Application 2: https://www.arcgis.com/apps/dashboards/0f775368e70445489d77f1b88dbf14cf

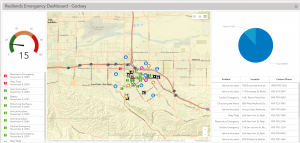
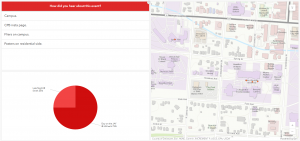
I created a dashboard app for the second application to monitor the responses to the OWU Student Interest Survey123. The dashboard has several features emphasizing important information, including location, event attended, and how the students heard about this event. The main location feature includes a map with the responses’ locations, demonstrating where the most popular events are located on campus. I also created a table to display how the students hear about the events, highlighting the most effective way to reach the student body and get the word out about stuff happening on campus. The final feature I’ve added is a pie chart that sorts the responses into the events attended to understand the most popular events.  
Godsey Week 5

Chapter 7: 3D Web Scenes 

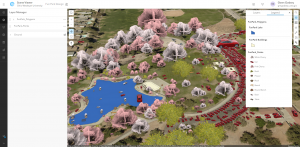
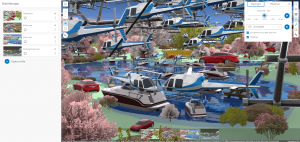
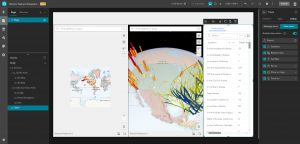
The 3D world has four advanced forms: extended reality (XR), virtual reality (VR), augmented reality (AR), and mixed reality (MR) – all of these make GIS more immersive and helpful to users. In ArcGIS, 3D web maps are named web scenes or 3D scenes, giving users several advantages over 2D maps, such as storytelling, urban planning, architectural design, and filmmaking. Web scenes can contain multiple layers grouped into photorealistic and cartographic categories. Photorealistic layers aim to re-create reality through photos and texture layers. Cartographic layers use attribute symbols to display physical, abstract, or invisible features (population density, flight paths, zoning laws, etc.). Scenes have four main types of elements, surfaces, features, textures, and atmospheric effects, and include the following types: 3D object scene layers, building scene layers (overviews, disciplines, category layers, and filters), integrated mesh scene layers, point cloud scene layers, point scene layers, and voxel scene layers. Scene Viewer, ArcGIS Pro, and CityEngine are primarily used to create web scenes that, once published, can be viewed in commercial-off-the-shelf client apps and custom client apps developed through ArcGIS API. ArcGIS Urban allows users to integrate 3D mapping with urban planning and BIM to create, manage, edit, and display plans, projects, indicators, and ideas. 

Application Idea: Create a 3D web scene of OWU’s campus, specifically on the Jay.

Godsey Week 4

Chapter 6: Spatiotemporal Data and Real-time GIS

Real-time GIS handles objects and events that move, appear, and change throughout time. Real-time data needs real-time GIS to locate/track targets and store, manage, search, display, and analyze data. Spatiotemporal data comes from various sources and can be categorized into the following groups: moving, discrete, stationary, and change. The key terms to know and understand while working with spatiotemporal data are: time measurement systems (units), time reference systems (time zones/daylight savings), time representations (arrangement of date/time), and temporal resolution (time interval of sampled events). IoT refers to the network of physical objects (various devices, airplanes, taxis, bicycles, lights, sprinklers, etc.) embedded with sensors and network connectivity that allow these objects to collect/exchange data. ERSI’s geospatial cloud provides users with ArcGIS Velocity and ArcGIS GeoEvent Server with real-time GIS. Both can meet the requirements to collect, process, and store high-volume and high-velocity real-time data generated by IoT. ArcGIS Velocity and GeoEvent Server share similar basic components: ingest, process, and outputs. However, ArcGIS is a relatively new real-time GIS product and introduces new types of items to ArcGIS: feed items, real-time analytics items, and big data analytic items. 

Application Idea: Create a dashboard app to monitor the smart Survey123 form to better understand students’ interests on the Ohio Wesleyan Campus.

Godsey Week 3

Chapter 3: ArcGIS Experience Builder 

ArcGIS Experience Builder allows users to create layouts, content, and widgets to interact with 2D and 3D data based on ArcGIS Online, ArcGIS Enterprise, HTML5, and ArcGIS API for JavaScript technologies. Web apps created using Experience Builder are called web experiences, the steps include: choosing a premade template/starting from scratch, selecting a theme, adding source data, refining layouts for devices, and finally saving, previewing, publishing, and sharing the web experience. Basic widgets perform as app tools including map, legend, layers, query, filter, edit, chart, elevation, profile, survey, and more. Layout widgets are containers that help keep widgets organized on users pages/windows including sections, columns, rows, panels, sidebars, and more. Widgets have two action categories: message and data actions. Message actions listen to triggers and in turn perform actions automatically, these can be sorted into three components: triggers, targets, and actions. Data actions have an action button that allow users to select from a list of actions to perform. 

Chapter 4: Mobile GIS

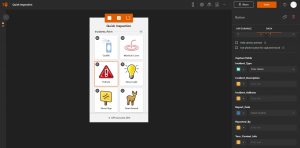
Mobile GIS has a number of features that provide advantages over the traditional desktop GIS: mobility, location, ease of data, near-real-time information, large volume of users, and versatile means of communication. Mobile GIS is accessible on mobile devices (smartphones, tablets), mobile operating systems (android, iOS), wireless communication technologies (bluetooth, Wi-Fi), and positioning systems (GPS, IPS). Owners of hosted feature layers/administrators in the organization can control various settings: add, update, delete features. Mobile app development includes the following approaches: browser-based, native-based, and hybrid-based. A relatively new product is ArcGIS Field Maps, which allows users to plan, track, understand, and capture data related to phases of field operations. 

Application Idea: Create a smart Survey123 form to better understand students’ interests on the Ohio Wesleyan Campus to improve student engagement and morale.

Godsey Week 2

Chapter 1: Get Started with Web GIS

Web GIS combines the web and geographic information systems (GIS). It allows users to interact with GIS apps and access information globally. Web GIS use has recently increased throughout various organizations, including government agencies, businesses, science research, and daily uses. Web GIS can be applied to several applications, including mapping/visualization, data management, field mobility, monitoring, analytics, design/planning, decision support, constituent engagement, and sharing/collaboration. Web GIS elements include users, groups, content items, and metadata. Web GIS’s main content items are data, layers, tools, web maps, scenes, and apps. Apps are what users are directly interacting with while using Web GIS and include configurable apps, ArcGIS StoryMaps stories, mobile apps, app builders, and more. The components of a Web GIS app include basemaps, operational layers, and tools. Basemaps provide a reference or context for an app; a wide variety of basemaps are provided, but users can also create their own. Operational layers are theme layers that can be interacted with. Finally, tools can perform query, geocoding, routing, and more tasks to solve spatial problems. 


Chapter 2: Smart Mapping and Storytelling with GIS

Feature layers are the most common type of operational layers and are essentially web services that can be reused in many web maps, scenes, and apps. Hosted layers are the most widely used operational layer published to the Esri geospatial cloud; they include hosted feature layers, hosted web feature service (WFS) layers, hosted tile layers, hosted vector tile layers, hosted web map tile service (WMTS) layers, hosted scene layers, hosted image layers, and hosted map image layers. Hosted feature layers can be published in the following ways: create a feature layer from a user’s data, create a feature layer from an existing template, and create an empty feature layer and define your fields interactively. Smart mapping allows users to visually analyze, create, and share professional-quality maps without the need for extensive cartographic or software skills. Smart-mapping styles include heat maps, color/size, comparison of two fields, relationship between two fields, dot density, predominant, type/size, continuous timeline (color/size), and vector field. ArcGIS Living Atlas allows users to find operational and basemap layers to use in projects. The following data can be found within ArcGIS Living Atlas: basemaps, imagery, boundaries, people, infrastructure, and environment. 


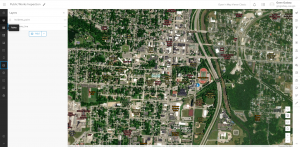
Application Idea: Based on the information I gathered from Chapters 1 and 2, my application idea is to mark buildings (dorms, dining halls, libraries) and departments (STEM buildings, history buildings, etc.) on the Ohio Wesleyan Campus using data provided by Delaware County Ohio GIS Data Hub. 

Godsey Week 1

Hi! My name is Gwendolyn Godsey, and I’m a senior majoring in Environmental Science with a minor in nutrition. I took Geog 291 during the first half of the semester, so I already have an ArcGIS Online account. While poking around ArcGIS Online in the courses section, I noticed the vast amount of training courses available, which is super cool! I found the ERSI Community and Comments page super exciting and could be helpful if I get stuck during this class. 

While reading Get Started: What Is ArcGIS Online, I found it interesting that it can be used independently and collaboratively. This feature makes this program extremely useful for several jobs and schools and can be applied in various ways. I also found it helpful that ArcGIS Online allows users to use their app (ArcGIS Companion) offline, making collecting data and managing projects in the field possible. 

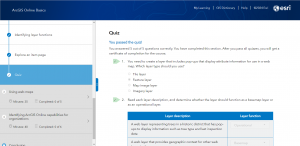
The second section (Exploring ArcGIS Online content) of the Web Course: ArcGIS Online Basics explains that the program’s main features include layers, maps, scenes, apps, and files. Layers are the primary way to work with geographic data, and different layer types include features, tiles, map images, imagery, elevation, scenes, and tables. ArcGIS Online, local files, and sketch layers are the three primary layer sources. There are also four main levels of sharing: private, group, organization, and public. 

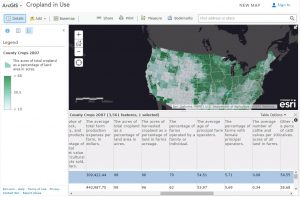
ArcOnline can be used to map agricultural land across the United States and calculate the total amount of agricultural land within the country. Mapping allows individuals to see where the most agricultural land is located, which could then be used to understand how climate change (for example) could affect these areas and food production. 

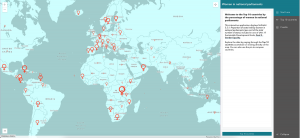
ArcOnline can also map social changes, such as women’s rights. The map below shows the top ten countries ranked by the percentage of women in their national parliaments. Mapping allows individuals to see what countries have the highest rate of women in government-related positions.