Plunkett Week 5

Chapter 7
Chapter 7 discusses using 3D web scenes such as VR, AR, XR, metaverse, etc. We learned that the two main groups of scenes are photorealistic and cartographic. Photorealistic recreates reality using photos to texture features, while cartographic takes 2D mapping techniques and moves them into 3D. I was surprised by the indoor 3D GIS. It made me wonder if you could create a campus map that included layouts of each building so students and professors could navigate more easily.

Application Idea
For my application idea, I think it would be interesting to create a thematic web scene that illustrates the population density of each city in Ohio. This way, you can visualize the population difference between each city and view which city has the densest population.

Plunkett Week 4

Chapter 6

This week’s chapter focused on spatiotemporal data and real-time GIS. I’ve heard about IoT, but wasn’t sure of its definition, so I made sure to look it up (it gave the definition later). I’ve never considered how many sensors are used in everyday life, such as how smart cars use sensors and GIS data to calculate routes and recognize road conditions. The ArcGIS dashboard seemed really useful with being able to use real time data to track crimes, environmental conditions, and social media.

Application Idea

I would create a dashboard showing real time air quality across the map. The dashboard would use data from air quality sensors from around the state. It would track various pollutants and have visual alerts for bad air quality and its location. I would also animate the data so that you could visualize the patterns and trends of the air quality.

Plunkett Week 3

Chapter 3

In chapter 3, we learn about the experience builder that allows you to create web apps with no programming. This builder seems accessible for those who have never worked with this type of program before, with its premade templates. I’ve been finding these tutorials easier than 291, which I was kind of surprised by. I enjoyed creating a map with a 2D and 3D perspective.Ā 

Chapter 4

Chapter 4 discussed how we have moved past using PCs and are now relying on smartphones and other wearable devices. Being able to use Web GIS on these devices is important for mobility and near-real-time information. One thing that caught my attention was using virtual reality. I feel like it would hurt my head trying to use a map in VR.Ā 

Application Idea

My application is kind of inspired by iNaturalist, but I think it would be interesting to use a web app that tracks the location and amount of invasive insect species in Delaware. The app would allow people to take a picture and provide their location. Some invasive insects are the elm zigzag sawfly, the spotted lantern fly, or asian longhorned ticks (not an insect).


Quick edit to say I have already completed the Delaware Data Inventory in Geo 291.

Plunkett Week 2

Chapter 1

The first chapter clearly explains the tools available for web GIS. I was impressed with the number of ways WebGIS can be used. I also like how accessible it is to use, it has a global reach, and allows you to share with people. It’s interesting how this technology came to be, the history was very informative.

Chapter 2

Chapter two focused on smart mapping and more informative terminology for ArcGIS. There are so many types of layers, and even different types of layers, such as hosted layers, have different kinds. Intriguingly, so much data can be turned into many different maps. Each map tells the story of its data and can make it easier to understand. Learning all this new terminology makes me question if people who have jobs in this field have all of it memorized or if they figure it out as they go.Ā 

ApplicationĀ 

I used the table on page 41 for some map examples. You could use a continuous timeline with residential data to watch patterns and trends of new houses built and their price, or you could watch which areas are still vacant.Ā 

Plunkett Week 1

Hello, my name is Gabrielle Plunkett and I am a senior majoring in Zoology. I’m from Cincinnati, Ohio and I have an orange cat named Finn. I took GIS 291 at the start of last semester so I may be a little rusty in the beginning, but I am excited to expand my GIS knowledge.

In 291 I believe I poked around the website a bit, but I don’t think I used it to its full potential. I remember having to upload something from it and it took a while to load. When looking at my profiles I can see I created web maps and feature layers. I looked around the gallery and thought it was interesting to see what data has been collected and maps that were made. The training section also looks like it’ll be good to use if I get stuck.

The introduction to ArcGIS was interesting and a good overview. I think one of the more interesting parts of the introduction was the ā€œbe mobile in the field’. Being able to create maps offline and also have the ability to sync them to the latest update has to be extremely helpful for fieldwork. Also being able to access it through a mobile app is cool.

The basics will definitely help me at the start of this course. I will have to look back and remember the difference between the layers.

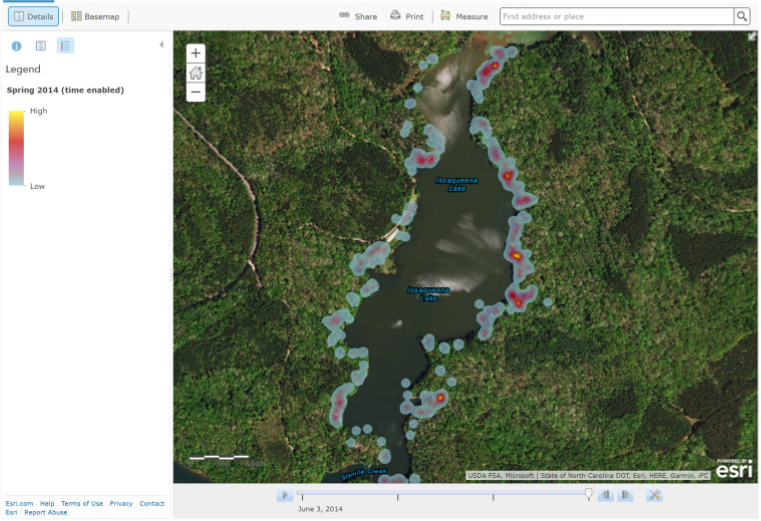
Search One:
My first search was ā€œArcOnline Plantsā€. I found a study using geospatial cloud computing to monitor the phenology of plants. This map in particular is a heat map that shows aggregated March, April, and May 2014 plant data. This type of map could be used to monitor flowering patterns during unusual fluctuations in temperature.

https://www.sciencedirect.com/science/article/pii/S1574954116301078#ab0005

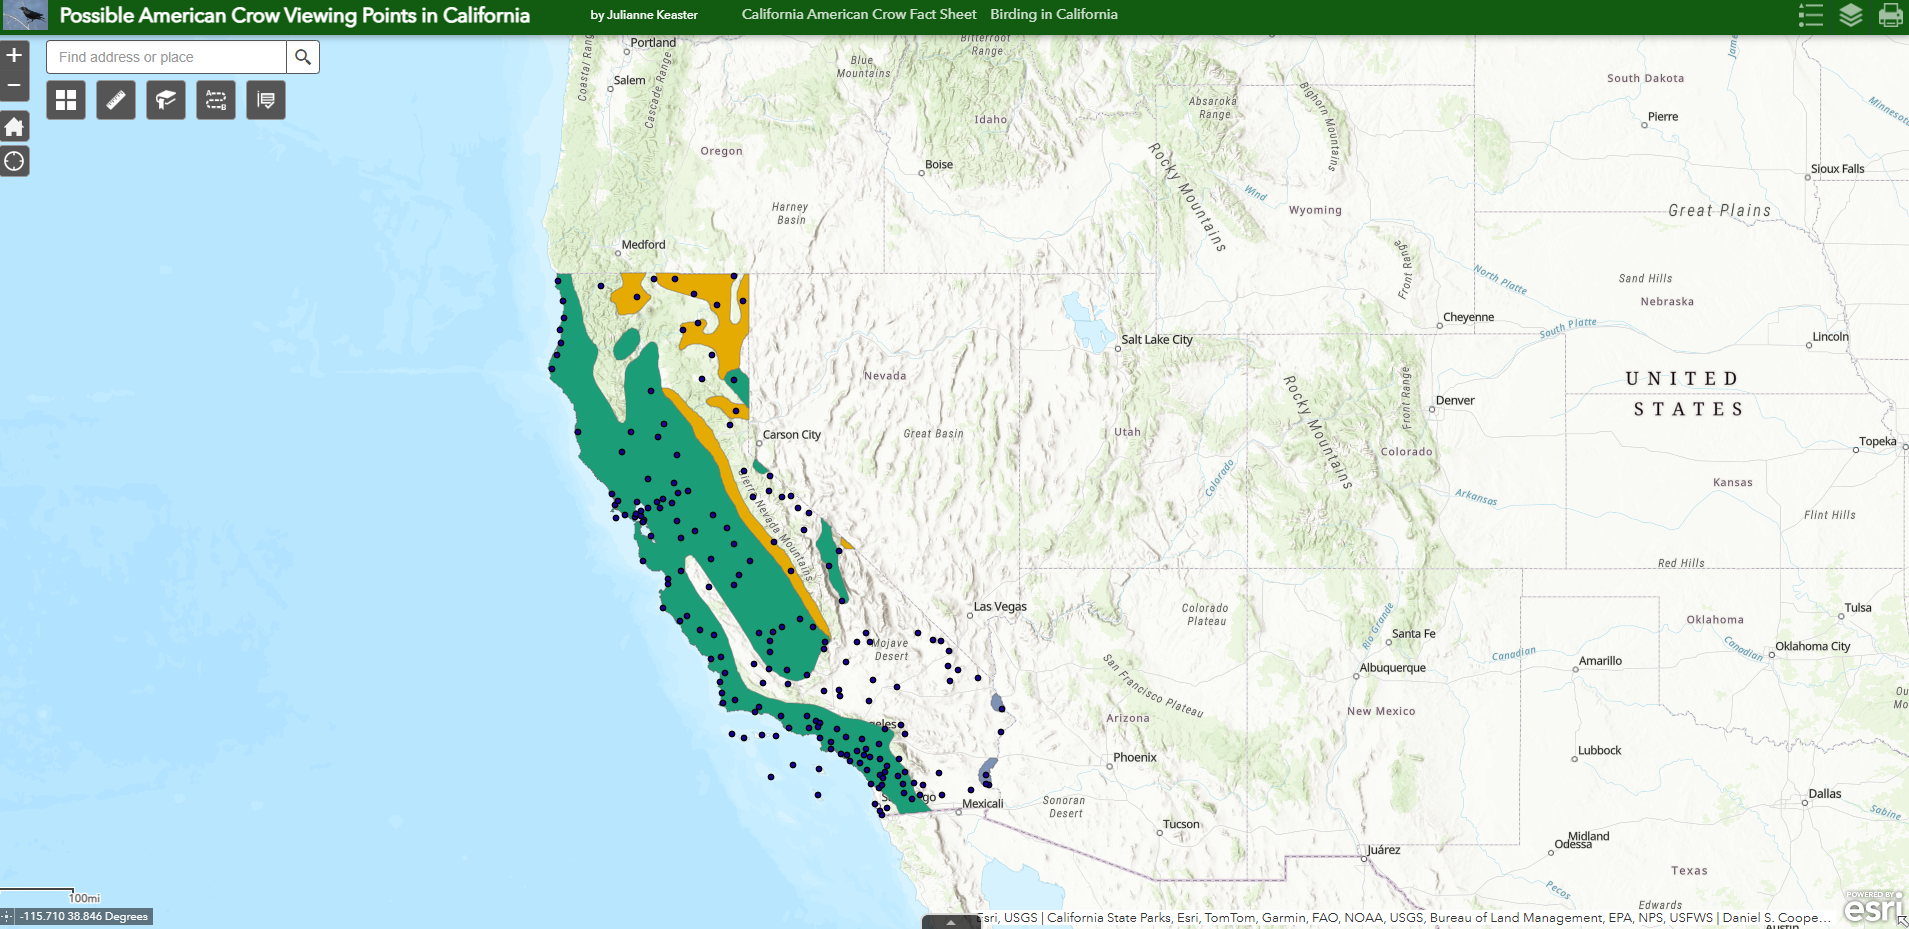
Search Two:
My second search was ā€œArcOnline Crowsā€. I have always liked crows so I decided to search and see what would pop up. I found this map for possible American crow viewing points in California. This map would be helpful if someone was out birding or wanted to research crows and needed to find locations they could be at.

https://www.arcgis.com/apps/webappviewer/index.html?id=8ec23699138c46a08660108f2f44699f