Using the experience builder and public maps on ArcOnline, I created an app that shows the best counties in Ohio to live in based on a handful of variables.
https://experience.arcgis.com/experience/5a1b8e6dc7d34a6c819dcd351faedaa2
Geography 292: Geospatial Analysis with Web GIS
Module 2: 3/16/2026 - 4/28/2026, OWU Environment & Sustainability
Using the experience builder and public maps on ArcOnline, I created an app that shows the best counties in Ohio to live in based on a handful of variables.
https://experience.arcgis.com/experience/5a1b8e6dc7d34a6c819dcd351faedaa2
Chapter 3:
Chapter 3 focuses on the experience builder, which utilizes multiple applications to create an informational experience. There’s many different flexible widgets with different functions to display information in a very organized way. The experience builder uses HTML and Javascript, but doesn’t require any programming knowledge.
What’s interesting about the experience builder is the apps and widgets can all be connected and dynamic, meaning that as long as the source data is consistently updated, the applications will be up to date. This is generally true with web services like this but it seems especially useful for the experience builder. After playing around with it, It’s incredibly intuitive and allows a lot of customization.
Chapter 4:
Chapter 4 is about mobile GIS and other non-PC ways to display GIS information. It also teaches how to build an application for mobile devices, but you can also make them for location-based services, volunteered geographic information, virtual and augmented reality.
Mobile services can allow for better positioning technologies than wired devices, which can be used for navigation or data collection. Typically, these are done via GPS, Wi-Fi, or bluetooth.
While WebGIS is inherently browser based, most mobile applications are native, meaning they’re on the device rather than being accessed by a web browser. This allows them to run better, as well as access more information about the device that browsers cannot access. Making these types of applications usually requires programming knowledge.
This chapter also discusses Survey123, a service that creates surveys. The data is stored to a hosted cloud, allowing up-to-date source information.
The other types of apps and platforms for Mobile GIS are:
Location-based Services: Tracks and provides local information based on a user’s current location (usually found via GPS)
Volunteered geographic information: Users voluntarily provide geographic information to be shared. Typically used locally in applications such as Mapping apps to report traffic, road work, accidents, police vehicles, etc.
Virtual Reality: A 3D simulation of a map that allows interaction and mimics how our eyes and bodies view and interact with the world. I fail to see how this would be very useful with GIS, however.
Augmented Reality: An overlay of computer information over a real-world camera view of the environment, using your device’s location and other spatial information, such as tilt and height.
Using the experience builder, I could create a real-time updated site that uses the information about historical disasters, as well as crime statistics, cost of living, etc. across different cities to show the ideal places to live.
Chapter 5:
An on-premise enterprise is a locally/privately hosted version of a service. WebGIS is typically stored on a globally accessible cloud, but you can create privately hosted server versions of WebGIS for security and connectivity.
WebGIS servers host a lot of data: millions of maps, rasters, shapefiles, tables, text files etc. There are many methods of storing and calling data that are used by WebGIS to optimize the user experience.
Caching is essentially a method of storing frequently accessed data in a way that it can be easily called for repeated or future use without having to call to the source. In the case of GIS, the rasters can be cached as image files on the client machine in order to display them without having to call to the host server every time the user zooms or pans the map display.
Vector tile data is a type of layer that varies in size based on data density to optimally store and display the data.
Feature tiles are similar to vector tile data in that it simplifies and optimizes the data for display. It stores the viewing extent as a limited number of tiles in the cache, allowing them to be easily called when the extent changes.
Chapter 6:
Chapter 6 covers data on an additional dimension (temporal) and how this is used to make constantly-updated real-time data be used and displayed in WebGIS. Theres 4 main types of spatiotemporal data:
Moving: data that moves across space over time (e.g. a car’s position)
Discrete: data that occurs in a space at a time (e.g. geotagging services that report accidents/construction)
Stationary: data at a space that changes over time (e.g. weather stations collecting data)
Change: data that changes its spatial extent over time (e.g. the extent of a wildfire spreading)
Temporal data can be stored as either a point in time or duration of time, with a start and end.
Internet of Things (IoT) is a connected network of sensors and connections that collect and exchange data. It’s essentially an entire system of information that is gathered and shared.
The IoT gathers trillions of data, much of it is geospatiotemporal and used in GIS applications. The examples above and more are stored in data centers where they can be accessed to create maps with real-time data.
In the previous week, I mentioned an idea for a real-time web application that uses a lot of this updated data to track crime statistics, weather, cost of living, etc. to create a map of U.S. cities that shows where is the best place to live. Using the extent of the U.S. however might be too large to do feasibly within this semester, but doing this within Ohio seems more reasonable.
Chapter 7:
This chapter covers 3D web scenes and how to work with the 3D maps in WebGIS. 3D scenes are a way to visualize maps more intuitively and with greater detail than 2D maps. These maps can be cartographic, which are stylized, or photorealistic, which uses real images of the surface to accurately represent how it looks. There’s many other visual stylization options used to make the scenes more accurate, visually appealing, or better convey the information.
3D mapping is related to the increased interest in virtual reality and the metaverse, both indoors and outdoors virtual environments. Potential uses include urban planning, using the 3D environments to predict how building certain projects will affect the city’s aesthetics or markets.
A potential application of 3D mapping is creating a 3D viewshed to show the views from various apartments in a city, and how building new projects might affect those views. This could give potential customers an idea of their view, which could affect if they want to buy/rent.
Chapter 1:
Much of the information covered in this chapter was covered in the readings and activities in the previous week, though much more in-depth. It focuses much more on the computer science of WebGIS, including listing the technologies and coding languages used to make everything possible, the different file types, etc. I had no idea that the biggest corona virus tracker was made in WebGIS, though it makes perfect sense that it would be the case. This book certainly explores the range of WebGIS applications, especially through it’s activities.
This chapter also covers the history of Web GIS, and vaguely how it reflects the history of the web and information sharing. It is very interesting to see how the growth of the internet has caused information to become so easily accessible and sharable. There are groups dedicated to collecting and processing information, but individuals can just as easily contribute to the massive catalogue of knowledge stored digitally, simply from their personal devices.
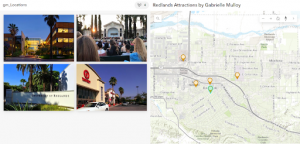
I completed the chapter 1 activity, creating and publishing a web application that displays attraction locations in Redlands, California, fit with popups with image attachments.
Chapter 2:
This chapter covers web stories and their importance, which is a type of web application like the one in the previous chapter’s exercise. There’s a chart in this chapter with a list of all the different ways to style a map for different purposes. This is important to do in ArcGIS pro, mostly for the user to be able to understand the data they’re working with, but I imagine that it’s significantly more important to do in WebGIS given that it’s likely non-geographers will be viewing the data. It needs to be formatted in a way that is easy and intuitive for people lacking a geographical background to understand. I believe this is also the purpose of their coding language Arcade, which is specially designed for visualization.
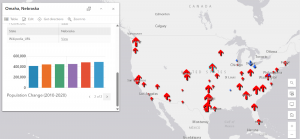
I completed the activity, which taught me how to customize pop ups, symbology, charts, and web stories.
My name is Gabrielle Mulloy, I’m an Environmental Science and Geography major.
I have taken GEOG 291 and other classes requiring GIS, so I am aware of the basics of what GIS is as well as using Web GIS.
GIS is a tool used to analyze and compute 2d and 3d spatial data. ArcOnline is an entirely online counterpart to ArcGIS Pro. Being online, it’s made much easier to share and publish data and work, with a heavy emphasis on creating web pages and interactable maps, scenes, and apps.
The interactive and sharing aspect of WebGIS seem to be the main appeal of this software rather than analysis like in ArcGIS Pro. It’s very intuitive and simple to make interactive elements. I can see how this can be used to easily create pages that can tell stories or show information in a really unique and valuable way. Sharing spatial information is a really difficult hurdle to overcome in geography, and the way ESRI designed this is genuinely really impressive.
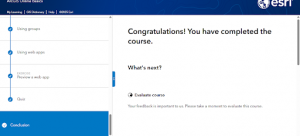
One of the courses I’m interested in is ArcGIS Online: Performing Analysis. I’m interested to see how analysis differs between ArcGIS pro and online, and I assume Online’s analysis is much quicker and simpler. ArcGIS Pro is very complex and not very user friendly, so I wonder how much time I could save by becoming familiar with ArcOnline analysis.
I’m also interested in the ArcGIS Experience Builder series. I always find it hard to explain geography to others, and so to be able to just write a website that conveys my point with interactive elements and maps would allow me to share so much more information. I’m very passionate about scientific communication, plus I think it would be a great job skill to know how to share scientific information using these tools.
I am well aware of GIS applications, but I found a new one using online GIS.
Theobald, R., Palmer, A., & van de Gevel, S. (2019). Interactive Mapping for Transparent Redistricting. Research in Geographic Education, 21(2), 11-38.
This article is first and foremost about how important geography is in politics, specifically in voting. This article is about how to inform the public about politics and gerrymandering using geospatial information systems. They asked survey participants to do an exercise in GIS to familiarize themselves with geography. While not strictly about Arc Online, it’s very obvious how this article could use Arc Online to tell stories and inform people about geographic and political history.