Fox Final

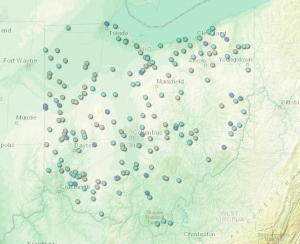
For my final, I made a map tracking tornado locations in Ohio over the past 5 years. I mapped this out to see if there are any areas where tornadoes are more likely to occur than others. Based on the original map (where I did not add elevation profiles) you can’t really tell which areas are more likely than others. Once I added the elevation profiles, it was very easy to tell why tornadoes do not occur as often within certain regions of the state. https://arcg.is/0nr0Tv1

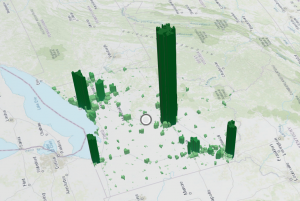
For my second application, I created a map showing population distribution across Ohio. The map shows which areas are more populated than others; the more populated areas are also represented by having a higher elevation, making them easier to see. As you can see, the more dense areas are those which are in close proximity to large cities, such as Cleveland, Toledo, Cincinnati, and Columbus. https://arcg.is/1vSrOi3

Fox – Week 5

Chapter 7: This chapter is about making our maps 3D and how that can be beneficial to our maps. Some advantages of a 3D GIS map are: wider applicability in storytelling, urban planning, architectural design, defense simulation, filmmaking, and many other industries. GIS technologies in 3D enable audiences to quickly understand the size and relative positions of objects. One thing I did think was really cool is that WebGIS has the ability to provide x-ray or radar vision, granted that it is some applications not all applications, which can be extremely useful in certain situations. Another useful feature brought up is the two view modes for scenes. Local mode displays features on a planar surface, and global mode displays features on a sphere. Both can be useful within our maps to display phenomena that cover a large or small geographic area, above the ground or under the ground. Another cool feature is the integrated mesh scene layers. It’s fascinating that WebGIS can take our data and create textures. This chapter also talks about how VR interacts with GIS data. The idea that as more data is updated into GIS, allowing for VR users to “interact” with the data and maps created is an amazing thing. It allows people to get a first person perspective on what has been created. 

One application based on this chapter could be the creation of maps showing the topography of Ohio Wesleyan’s campus over multiple decades. It could be useful information to the university and just cool information to have in general. 

Fox – Week 4

Chapter 5: This chapter digs into how web maps actually run smoothly online and why caching is such a big deal. The basic idea is that instead of making the map redraw every time someone opens it, you “prebuild” all the little map tiles (either as raster or vector tiles) and store them. That way, when users pan or zoom, they’re just loading those premade tiles which is super fast and easy on the server. This chapter also talks a lot about on-premises Web GIS, which basically means setting up your own servers to host your GIS instead of using Esri’s cloud. It’s great for organizations that need extra security, have sensitive data, or just want full control over performance. You trade convenience for control; you have to maintain the hardware and software yourself, but you don’t depend on outside servers. The chapter walks through how tile caching works and when to use different types of layers. Raster tiles are the “old-school” method, simply just images of the map. Vector tiles are lighter and let users restyle maps on the fly, so they’re great for modern web apps. There’s also some hands-on stuff about publishing tiles from ArcGIS Pro to your portal or server. 

Chapter 6: Chapter 6 shifts from static maps to live data; maps that move, update, and change over time. The focus is on spatiotemporal data, which means data that changes in both space and time (like vehicles moving around a city or sensors sending updates every few seconds). The chapter explains how real-time GIS works: data gets streamed in from devices or sensors, processed on a server, and then instantly visualized on a web map or dashboard. You can show things like traffic, weather, or emergencies as they happen. These live maps can allow users to make time enabled layers and use time sliders in web maps, therefore letting users “play back” how events unfolded. There’s also a big focus on designing web apps that can handle lots of changing data without slowing down. This chapter also talks about how to filter data, use time windows, and make animations that are actually useful instead of overwhelming.

For a real project, it would be cool to make a Campus Emergency Response Map using ideas from both chapters. I could get some data on campus buildings, defibrillator locations, and safety camera spots. I could also add real-time layers showing live campus security alerts and patrol vehicle locations. The web map would update automatically when something happens like an alarm or an emergency call. A dashboard could show current incidents, response times, and even a playback of how things unfolded over the last 24 hours.

Fox – Week 3

Chapter 3: This chapter really shows how easy WebGIS is compared to the desktop version (in my opinion). WebGIS allows us to create our own web experiences using flexible layouts, content, and widgets that interact with both 2D and 3D data. We can start with templates for mobile-adaptive apps, modify template layouts for a custom design on different screen sizes, or even build apps from scratch. The ability to do those things adds to the availability of this application and how easily one can understand it. When using these applications, you follow a little pattern on how to complete the maps. It goes: pick a template or start from scratch, pick a theme, add your data, add and move around your widgets, refine your layout, and finally save and share your maps! A widget is a JavaScript and HTML component that encapsulates a set of focused functions. Experience Builder provides two types of widgets: basic and layout. Basic widgets can perform as app tools. Basic widgets include map, legend, layers, query, filter, edit, chart, elevation profile, survey, and more. Layout widgets help organize widgets on your pages or windows. Layout widgets include section, column, row, fixed panel, sidebar, and more. One important thing about widgets is that you need to pay attention to your version of ARCGIS because the ArcGIS Online edition doesn’t allow custom widgets; the Portal for ArcGIS edition allows the deployment and use of custom widgets; the developer edition allows the creation, deployment, and use of custom widgets. Overall, just be aware of your GIS and the different things you can do with it

Chapter 4: This chapter talks about mobile GIS and how beneficial that is. I think that offering a mobile version is amazing as it increases the availability of ArcGIS, giving more people the opportunity to learn it. However, there are a few disadvantages to mobile GIS; the small size of mobile devices imposes limitations on speed, memory size, battery power, bandwidth and network connections, screen size, and keyboard size. As an “owner” of a hosted feature layer, you’re also able to be an editor tracker. Editor tracking is the ability to track who has changed the data of a feature layer and when the change was made. Editor tracking can help create more accountability and quality control over the edited data. This is, if you choose to enable it on your layers. A feature layer can contain a feature template, which you can define in ArcGIS Desktop or Map Viewer in ArcGIS Online. A feature template defines the types of data items that users can add to a layer. A template ensures data integrity and makes editing easier for your users. There are also 3 different approaches that can be taken with mobile GIS: browser-based, native-based, and hybrid-based. ArcGIS provides a suite of apps for field operations as well, including ArcGIS Field Maps, ArcGIS Survey123, ArcGIS QuickCapture, ArcGIS Navigator, ArcGIS Companion, ArcGIS Earth, ArcGIS Mission Responder, and ArcGIS Indoors mobile viewer. 

One application of what was talked about in these 2 chapters would be the ability to create a map of tornado locations in Ohio over the past 5 years to see if there is a recurring pattern within those locations.
Fox – Week 2

This week, I read chapters 1 and 2!

Chapter 1: The beginning of this chapter talks about the multitude of applications WebGIS has. One that really stuck out to me was when the book talked about the global outreach of WebGIS; this is because sharing information is so important, and allowing these maps to be shared globally can have so many different advantages. This chapter also talked about “The Science of Where” and how it has two definitions: one meaning is that GIS is itself a science, as the scientific basis for GIS technology, and the other meaning is that GIS has been used for science as an effective tool for making scientific discoveries. This chapter also talks about the many different groups that can use WebGIS and how each of them could use it, like the Government and just people in their daily lives. This chapter also talks about how WebGIS is opening up a new “gateway” for GIS as it allows for organized, secure, and facilitated access to geographic information products. Also, how GIS servers allow you to create maps and ready-to-use content, such as ArcGIS, which provides tens of thousands of data layers and maps. And finally, how users can search, discover, and use the layers, maps, and apps on desktops, in web browsers, and on mobile devices anywhere, anytime. GIS is an ever evolving field, and by increasing the access people have to GIS programs, more people can familiarize themselves with this amazing application

Chapter 2: The start of this chapter talks about feature layers: the most common type of operational layers. There are a few different types of hosted layers as well. A hosted layer is just the data that has been populated and saved to WedGIS. The types are: hosted feature layers, hosted web service layers, hosted tile layers, hosted vector tile layers, hosted web map tile service layers, hosted scene layers, hosted image layers, and hosted map image layers. Each one of those hosted layers holds different information about your map layers. WebGIS also introduces us to a thing called “Smart Mapping.” Smart mapping enables us to visually analyze, create, and share professional-quality maps easily and quickly with minimal cartographic or software skills. Smart mapping uses intelligent defaults, data-driven visualizations, and innovative workflows. It delivers continuous color ramps and proportional symbols, improved categorical mapping, heat maps, and new ways to use transparency effects to show additional details about your data through a streamlined and updated user interface. Unlike traditional software defaults that are the same every time, smart mapping analyzes your data quickly in many ways, suggesting the right defaults when you add layers and change symbolizing fields. This smart mapping technology can make mapping easier for every user, especially those who did not take GOEG 291 and have to deal with making all those maps from nothing. 

With what was talked about within these 2 chapters, one could map the continuous timeline of buildings on Ohio Wesleyan’s campus. I think that would be a super cool thing to look at and see the addition/destruction of buildings throughout this campus’s history.

Fox – Week 1

Hi my name is Faith Fox and I am a sophomore majoring in Environmental Science and Pre-Law. For this week, I took the quiz and scheduled my meeting for both week 2 and 3.

I did all of the other requirements and the ArcGIS stuff for this week back in GEOG 291!