Keckler Final

App 1: Story App

https://storymaps.arcgis.com/stories/55108ead79bc42979a28e6dfd510a0b9 

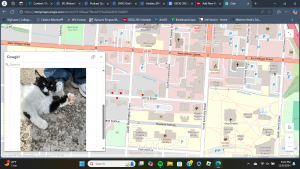
For my first application, I collected the locations of cats around the campus and immediate area- as well as some other cats that I wanted to showcase not limited to this area- in order to create a map. Clicking on the points provides brief descriptions of each cat including if they are outdoors, can be pet, and a picture or two of them. From that point, I created a story app, called “Delaware Cats: and other notable felines,” where users can interact with my map and learn a bit about the risks of allowing pet cats to freely roam outdoors such as contracting diseases, fighting, cars, etc. I also provided a video where users can learn about spaying and neutering cats since feral cat colonies are an issue in many areas- including Delaware- and spaying and neutering improves the animal’s quality of life. Then, I concluded with a couple of image galleries of my cats alongside a very old picture of me and my old cat Snoopy.

App 2: Instant App

https://owugis.maps.arcgis.com/apps/instant/3dviewer/index.html?appid=ac103aa3dd7b42af91bd020ab6386692

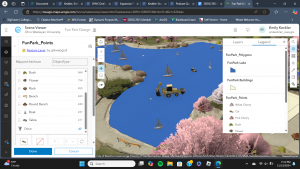
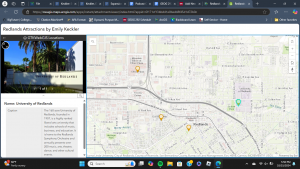
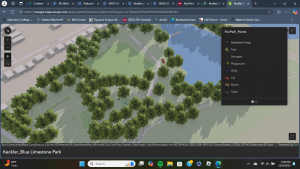
For my second application, I created an Instant App of my 3D Web Scene of the Blue Limestone Park. I added trees, cars, swings, benches, a table, and other playground structures using the fun park layer from the seventh chapter. Unfortunately, the models would not cooperate with me enough to rotate, so everything is facing the same direction. In addition to that, the sizes of the trees are misleading- many appear much larger on the map than they do in reality. Regardless, this scene can be used to gather an idea of what the park is like and the amenities that it has to offer visitors.

Keckler Week 5

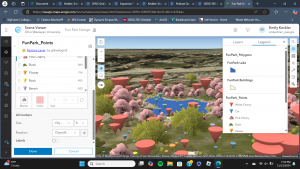
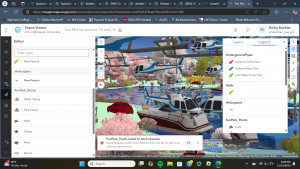
When I got onto ArcGIS, I was notified of a new update- how exciting! Chapter 7 was by far the most fun chapter to interact with. I greatly preferred working with 3D in this chapter compared to in the previous chapters. Apparently, you can even make clouds in GIS- which sounds like a fun detail to include when looking at architecture in an area with frequent rain and overcast. Throughout the tutorials, I found myself enjoying trying out different object symbols within the Fun Park. There were cars- represented as backhoes in my scene- in the lake and other peculiar places; this was also the case with the boats. That was a very weird detail. I could not locate “Elevation Mode” while I was completing the tutorial, so I just went on without it. It is a nice feature that the Fun Park scene used for the latter two tutorials can be updated by anyone, but the scene became very messy. My laptop’s performance dropped so significantly from all of the objects, and error messages were popping up about the scene’s server. I also could not locate the tools within the Analysis section for the final section of the Tutorial. Once I reached that point, I ended the chapter. 

A final project idea that I have could be to map trees, benches, plants, etc. around the residential or academic sides of campus to create a 3D web scene. Another potential idea would be to map out the locations of public benches and other amenities at the Blue Limestone Park just a short walk from Sanborn. Seeing where benches and other amenities are- or are not- can be insightful as to accommodations that the city makes to be accessible to people who may feel the need to sit or activities that are available at this park.

Keckler Week 4

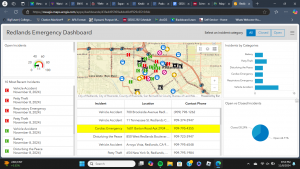
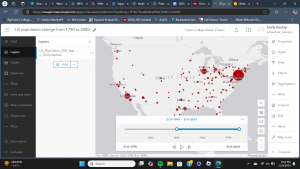
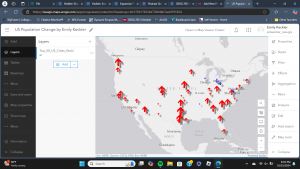
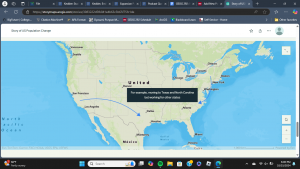
Chapter six was a welcome change from last week. It was more within my level of understanding and comfort compared to working with 3D maps and mobile apps. There were a couple things that tripped me up, such as the coding. Initially, I had made a mistake with my coding because I was having trouble understanding the directions in the tutorial. Luckily, the changes that the codes made were immediate, so I could act accordingly once something did not appear or appeared incorrectly. Though, the heart icon would not work at all, so I proceeded despite that hiccup. I do wonder about how the emergency information is input and updated so frequently. Do dispatchers input the information, and it is input into GIS in tandem? Or is there another process? While putting together the animation for the population change, everything went as it should. The final animation was a bit anticlimactic, though. The slider moved itself and showed how populations moved west into the states and so forth. I am not quite sure what I expected, but the slider did precisely what it was supposed to. It showed the change in population within the US over the past two hundred years over a few seconds.

An application idea that I have from chapter six could be to use the Delaware Data to show how parcel plots in the county- or maybe just the city- have changed over the past ten or twenty years since the county has been growing so much. Another idea that I have could be to document all of the places I go to throughout a regular day- perhaps a week- and make a time slider of that to see where I go to and how much time I spend in each place throughout the day.

Keckler Week 3

Working with 2D and 3D maps for chapter three was not nearly as exciting as the previous two chapters. I found working with the 3D for the tutorial to be a hassle more than anything. After completing the tutorials, I still do not see the point in having a 3D feature to represent hurricane and earthquake events. I also had issues configuring my table widget; there was not any space to fit it anywhere, so the widget is awkwardly overlaying the map. Otherwise, everything else went fairly smoothly after accounting for some changes between the tutorial and software over the past couple years.
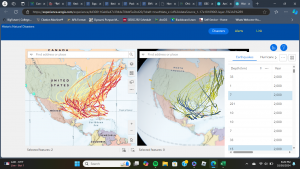
Chapter four was peculiar to me in that it seemed like a glorified advertisement that demanded the download and use of different apps only for them to be used over a brief period of the tutorial. While mobile accessibility is becoming more necessary, the limitations of a mobile device concerning computing power make it pale in comparison to working on a PC. Why download three apps when I could just open three tabs on my laptop in half the time. Right now, I feel like the PC is more efficient than mobile. Despite that, I did find it valuable to put different GIS apps to use for this tutorial.
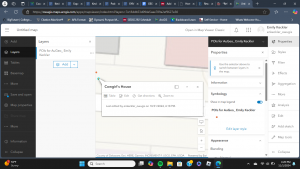
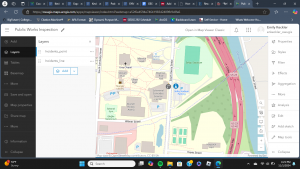
A couple ideas that I have for potential apps are to make an app showcasing parks and nature preserves around Delaware or an app that uses survey inputs to document squirrel sightings on campus. Showcasing natural areas in a 3D setting would show off landscapes better than a basemap overview on GPS. A map about squirrel locations would be fun since squirrels are common on campus, and there would be no shortage of potential submission material for interested parties.


Delaware Data Inventory:

Street Centerline: This layer shows every paved road in Delaware County intended for appraisals, emergency response, reporting, ODOT, and other related purposes. Around the Delaware State Park- just north of Delaware City- the paved surfaces within the park are drawn like squiggly hands. There are more dead-ended roads than I expected there to be.

Zip Code: This layer shows each zip code within Delaware County. These codes were changed in 2003 in response to the 2000 census, but this layer in particular was made in 2005 and is updated regularly. This layer was used for attributes in the centerline. The zip code for Delaware City is 43015, and my home’s zip code, 43334, is included in a minute portion around the northeast most edge of the county.

MSAG: The Master Street Address Guide is made to conveniently identify the boundaries of cities, villages, and townships within Delaware County. There are 28 political jurisdictions within Delaware County, so this dataset clarifies those boundaries.

Recorded Document: The points on this set are meant to correlate within documents in the Delaware County Recorder’s jurisdiction that are not included in active subdivision maps that show the details about the property. Looking at the different points, I am still not exactly sure what information would be held about the points. There are many points that are in people’s backyards or in streets; the points just reference a page in a book, but the relevance of these points is unclear.

Survey: Each point represents where a land survey has been conducted within the confines of Delaware County excluding surveys from Old Survey Volumes (1-11). In addition, each point is connected to a file with information on the land survey.

Parcel: This dataset identifies the legal boundaries of properties within Delaware County. You can find all sorts of information about people’s homes in this map including Land Value, Number of Bedrooms/Baths, Tax Numbers, etc. If you view different campus buildings, the owner is listed as Ohio Wesleyan University, Trustees OWU, or TR Ohio Wesleyan University.

GPS: GPS monuments established in 1991 and 1997. This set is strange in that what exactly the monuments are is unclear- even when searching through the pop-up. For example, if you click on the blue dot in between the observatory and Stuy, the name of the monument is just “Delaware,” and there is little supporting information about each particular monument within the set.

Precinct: Identifies the bordering of voting precincts in Delaware County. Each precinct name includes the township or city name sometimes followed by a letter and number if the township contains multiple voting precincts.

School District: Every school district within Delaware County; this data was originally acquired through the county auditor’s parcel records. School districts within the county include Big Walnut, Buckeye Valley, Delaware, Olentangy, and others. Fun fact: The school that I graduated from, Highland, is in a small section of the county similar to my home’s zip code.

Subdivision: There are many condos and subdivisions- specifically concentrated in the southern half of the county nearing the Franklin County and Columbus area. Subdivisions include areas of land that are split into smaller sections/parcels to be sold. Some subdivisions that I found predominantly included farms, condos, and what I presume to be those exclusive housing developments.

Township: The 19 townships of Delaware County. Delaware City is an interesting case with how the layer is organized. The central part of Delaware has a township name of “Delaware.” Meanwhile, there are smaller sections inside and around that mass with the township name of “Delaware Township.” A similar phenomenon happens with Orange Township and Berkshire Township.

Tax District: All tax districts of Delaware County with Tax District codes. The city of Delaware is broken up into many tax districts. Some tax districts cover a wide area of land while some encircle a few houses. Tax District 50 is just a block that surrounds Delaware Fire Station #303.

Address Point: As stated in the title, this set contains each address in Delaware county. Intended mostly for emergency response systems using reverse geocoding. I did find an address point within a pond in the Sheffield Park in between the Alum Creek Reservoir and Hoover Recreation Area (X: 1849668.892400, Y: 191484.601000).

Annexation: This set shows land that has been annexed between 1853-present. Annexed land includes the Delaware City Area, Ashley, Ostrander, Sunbury, and other areas in the southern edge of the county.

Condo: The bulk of condominiums within the confines of Delaware City are in the southern end of the county near Franklin County and the Columbus area- just like how the subdivisions are. The Powell area appears to be one of the most densely populated with condo units compared to other areas in the county.

Municipality:  This layer showcases the boundaries of Delaware, Sunbury, Galena, Powell, Ostrander, Shawnee Hills, and parts of Ashley, Columbus, Westerville, and Dublin that are all present within the Delaware County lines. There are holes within the Delaware Municipality, though. 

Building Outline 2023: This layer contains every building within Delaware County as of 2023. There are structures that appear on the map that are not highlighted as a building, so I wonder if those are sheds, barns, garages, a patio, or something else that does not fit into the criteria to be considered a building. It could be that the basemap itself has not been updated to accommodate the exact changes in buildings.

Delaware County E911 Data: Certified addresses within Delaware County intended specifically for 911 agencies for emergency response. I could not actually interact with this dataset past its summary.

PLSS: Public Land Survey System are meant to show the boundaries of the US Military and the Virginia Military Survey Districts of Delaware (two PLSS). The map is organized in orderly rectangles except for the westmost edge of Delaware County where the shapes are variable. The orderly rectangles denote the boundaries of the US Military PLSS while the unruly shapes denote the boundaries of the Virginia Military PLSS.

Farm Lot: Farm Lot boundaries within the US Military and Virginia Military Survey Districts in Delaware County. According to the set, all of the land in Delaware county is within a farm lot boundary.

Original Township: There were still 18 townships within Delaware County. A majority of these townships were arranged in rectangles while the westmost townships were shaped more erratically. Similarly to how the PLSS boundaries are currently.

Dedicated ROW: Right-of-Way; public roads where transportation, driving, bicycling, and walking is permitted to take place. Roadways not included would likely entail areas where through traffic is not welcome. This layer was created through the Parcel data.

Building Outline 2021: Building outlines for every structure in Delaware County in 2021. Can compare with Building Outline 2023 to monitor new development over the past couple years within Delaware County.

Map Sheet: These are the map sheets of Delaware County. Our campus is split into three: Sanborn and the sororities, residential side, and academic side. Otherwise, there is no clarification on why the map sheets have been arranged or any other details; there are just map sheets compiled into a layer over the basemap of Delaware County.

Hydrology: This layer shows the major waterways in Delaware County. There are 24 major waterways that pass through or reside in the county. Nearby, there is the Delaware Reservoir with the Olentangy River flowing into it as well as through Delaware City with the Delaware Run- which runs through campus- connecting to that river. Then, there is the Alum Creek Reservoir; I personally enjoy visiting the dam there.

ROW: Right-of-Way designations for roads in Delaware County. This is updated through updates in the Parcel data, but the map itself is not functioning at the moment.

Delaware City Contours: I could not access this layer!
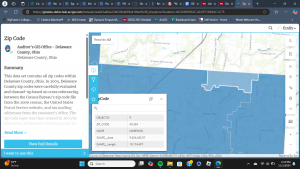
Here is a teensy bit of my hometown as a bonus!
Keckler Week 2

Chapter One was very informative and helped me in getting more intimate with ArcGIS. It developed the significance of GIS as a whole in being used as an accessible way to share information across the globe. I did need a bit of outside help with figuring out how my laptop works with uploading excel files and C: drives, but that was my most significant hurdle in navigating Chapter One’s tutorial. Turning a map into an Attachment Viewer App was far more straightforward than I had initially thought it would be. After completing the tutorial, I did go ahead and make a little app myself to help reinforce everything I had learned thus far. Once again, uploading excel files and C: drives were a battle, but I came, I saw, and I conquered. 

Chapter Two was a jump from the preceding chapter in the amount of content that it covered- especially within its tutorials. The emphasis on creating a story web app following a “Who, What, When, Where, Why” template was reminiscent of writing summaries in first and second grade. Though, that model does hold up in a more nuanced and complex application as GIS. I did come across an issue with renaming something, but I let it be and had an opportunity later to rename. There were also a few details that had changed from the tutorial (ie. there was no “subheading” or “large paragraph” within the Story Map App Launcher- just “heading” and “paragraph”), but I persevered. I took a decent amount of time going through everything to make sure that it was right, so I would say that everything went smoothly on my end. Something that I noticed in the book was that, when directed to draw an arrow from New York to North Carolina, the book had drawn the arrow to Virginia instead of North Carolina, so that must have gotten past the editing team.

An idea that I have for an application from the content of Chapters One and Two is to survey around campus as well as the Downtown Delaware area for different outdoor cats. This could be a mix of quantitative data for the locations of different cats as well as qualitative data (ie. if the cat is approachable,etc.). I could send a survey to people willing to share information on the cats that they have spotted in addition to venturing around to take photos of and mark the locations/addresses of where different outside cats can be found. Another possible idea would be to document the different types of flora that can be found on campus- specifically bushes and flowers.

Keckler Week 1

Hello; my name is Emily Keckler. I am a freshman majoring in Environmental Studies. I did not take GEOG 291, so this is going to be a fresh experience for me- especially since I have very little background with geography in general.

Looking into my account I found that I have 1,000 credits to use, and- looking further- I found that there are certain online courses that require an exchange of these credits. This is particularly interesting and peculiar to me as using this program already costs a decent chunk of cheese, so it tickles me that there are additional exchanges in order to access certain “premium” content- even after purchasing a “premium” account. 

There is also a robust GIS community on this platform- blogs, forums, community posts, articles, etc. I intend to take advantage of these for questions and other troubleshooting when I inevitably encounter something new.

In “Get Started: What Is ArcGIS Online” I read into the basics of viewing scenes and maps. Now, I can have a better idea of the different capabilities that I have when interacting with media on this platform. From there, I read into the different types of maps including time and floor-aware maps.

I also began to look into the process of making an app. There are many aspects to consider when putting one together including: the type of app, audience, creating a map, inclusion of photos and text, etc. Collaboration and engagement are a particularly critical aspect in utilizing GIS to distribute information within an organization, group, or publicly, so extra emphasis is placed on that throughout the overall reading.

When I did the “ArcGIS Online Basics” web course I was introduced to some GIS terms, and I was able to familiarize myself with different types of layers alongside their sources. In addition, I made a map of mountain trails, got a little bit of experience with navigating a map, and I learned some of the various app builders under the ArcGIS umbrella. Upon completion of the course, I was left feeling a bit lost on navigating maps.

Since I did not feel very confident in my understanding of GIS from the first course that I took, I decided to take a second one- “Exploring GIS Maps.” This second course revisited some of the aspects of the first which made me feel more comfortable in being able to navigate maps and placing bookmarks on certain locations.

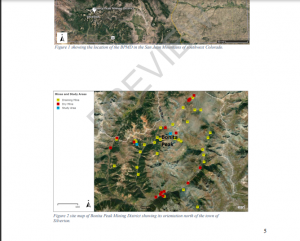
For GIS application areas, I decided to look up “ArcOnline Superfund Sites,” and I found a master’s thesis on the acid mine drainage around superfund sites within the Bonita Peak Mining District (Dorsk, 2020).

From: “Using Rare Earth Elements and Geochemical Patterns as In-Situ Groundwater Tracers at the Bonita Peak Mining District Superfund Site”

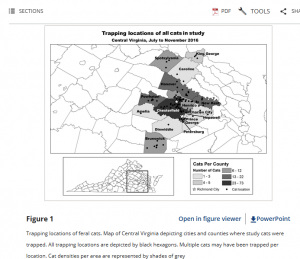
I also chose to search “ArcOnline Trap Neuter Release Cats.” An article that piqued my interest used information from a Central Virginia Trap, Neuter, Release (TNR) program of feral cats trapped within areas also populated by people to assess the risk of feral cats transmitting diseases (such as rabies) in local parks, schools, etc. (Taetzch, Bertke, & Gruszynski, 2018). 

From: “Zoonotic disease transmission associated with feral cats in a metropolitan area: A geospatial analysis”