VanderVelde – Final

Evelyn VanderVelde

Spring 2023

GEOG 192

Dr. Krygier

Dashboard

above is a link of the Michigan counties overtime that I created for a previous class that I have converted into a dashboard including information about the map and a table of counties and their average population over time. As well as showing information about each county in a pie chart.

App Created

App i created with the map, this map is published and shared with everyone who can use the map on their phones or on their desktops.


Week 6 – VanderVelde

Chapter 7:

  • Understand the basic terminology of web scenes
  • know the types of scene layers and technologies to create them
  • create web scenes using scene viewer
  • Understand the value of 3D in XR, meta verse, indoor GIS and AEC
  • Configure 3D symbols in scene viewer
  • Create and use feature layers with z-values enabled

7.2

7.3

Week 5 – VanderVelde

We skip chapter 5!! im so happy!

Chapter 6:

  • understand spatio-temporal data terminology
  • Learn the concepts of IoT, Sensor networks, smart cities and other related frontiers
  • Understand the advantages of stream layers
  • learn about ArcGIS Velocity capabilities
  • Use ArcGIS dashboards to monitor real time data
  • Configure actions and Arcade-based formatiign
  • Create Time-enables web layers and apps to animate time series data

Week 4 – VanderVelde

Chapter 3:

  • know why and when you need experience builder
  • familiarize yourself with experince builder terminology
  • learn the workflow for creating web apps using experience builder
  • understand widgets and their conent and styles
  • understand triggers and actions
  • configure and use charting, filtering, and other widgets

Chapter 4: 

  • – Understand the concepts of Mobile GIS, LBS, VGI, VR and AR
  • Understand the 3 approaches to building mobile apps
  • Create smart surveys using ArcGIS Survey 123 web designer
  • Collect data using survey123
  • Configure Editable feature layers and feature templates

For 4.3 step 17, I am literally so confused, Krygier you posted a photo i think to go with the question but i dont know what that means and its 10:10pm rn.

I did it, this seems like really easy rn but also its very tedious which makes it harder to get done.


Week 3 – VanderVelde

Chapter 1- Getting Started with Web GIS

  • Grasp the concept and advantages of web GIS
      • it removes the distance constrain and allows more freedom of interaction globally and access to information faster
      • a large number of users low cost per user
      • easier to use, and maintain and better cross-platform capabilities
  • Understand the deployment patterns of web GIS
      • government, business, science, and daily life
  • Learn the components of the new-generation Web GIS
      • Geospatial cloud powers GIS now
      • a portal that helps to organize, secure and facilitate access to GI products
      • servers let you create content
      • users can search learn and use the layers maps and apps on almost any tech anywhere anytime
  • understand the technical evolutions and trends in web GIS
      • closed to open web
      • from one-way to two way information
      • cloud GIS delivers GIS functionally and ready to use
      • mobile is becoming the pervasive web GIS client
      • Map visualization is 2D, 3D and virtual and data sources goes from static to real time and spatiotemporal big.
  • understand the concepts of web services and hosted feature layers.
      • the layers can include, feature layers, tiles, vector, map image, image, science, CSV, tables, and open Geospatial consortium layers like keyhole markup language
      • 3 types of components for Web GIS layers
  • publish hosted feature layers from CSV files
  • learn the workflow for creating web maps and web apps

Chapter 2- Smart Mapping and storytelling with GIS

  • create hosted feature layers using CSV files and geocoding
      • there are hosted feature layers, hosted web feature service layers, hosted tile layers, hosted vector tile layers, hosted web map tile service layers, hosted scene layers, hosted map image layers
  • design layer styles using smart mapping
  • configure pop-ups with multimedia content and arcade expressions
  • understand ArcGIS living at last contents
  • create and ArcGIS story maps story with sidecar, express maps and swipe blocks

Week 1 – VanderVelde

Hello, my name is Evelyn VanderVelde. I am a senior from Holland, Michigan majoring in environmental science and minoring in botany.
  • for my assignment this week, I already have a account made from the 191 class with Krygier and my Intro is above. I updated my Bio so now y’all can know some basic things about me.
  • In my blog I found all of my assignments from 191 as well as that the website format has updated and these knew posts are bugging me. I liked the last formatting of the posts to be much easier because they were more simple.
Things I learned from the ArcGIS webpage, Get started: what is ArcGIS online ->
  • Share and Collaborate – I learned that sharing your maps on ArcGIS online is easier with the groups that are private. I have some experience with groups with my job with the Michigan DNR this past summer. As well as making collaborations with other groups to share each others maps and work on each others content.  Other ways to share maps and other content include embedding them in web pages, on blogs, in web apps, and through social media. Use focused apps to collaborate with colleagues in the field, office, or community.
  • Be mobile in the field- On arcGIS online you can also access your maps in your mobile device whether this be a tablet or smart phone. Meaning that data can be collected directly from the field onto the map itself and updated to the entire crew in real time.
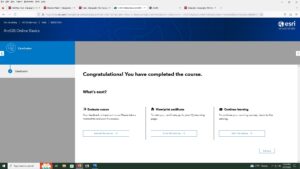
Training course:
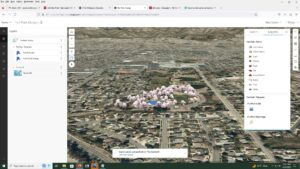
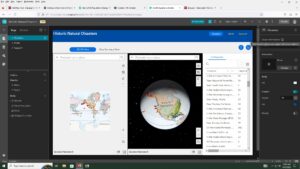
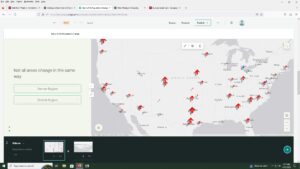
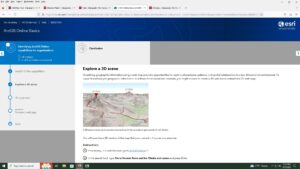
  • I found that I learned about exploring a 3D scene
  • I also learned that when you move to a different bookmark in one of the tutorials that the base-map changes from Topographic to Imagery
Two articles:
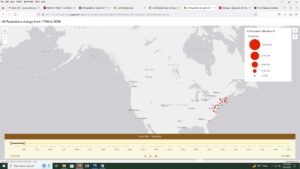
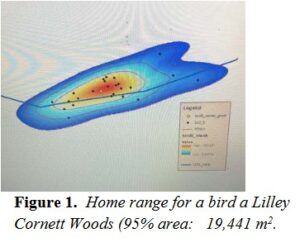
  • for the first article i looked up arcOnline hemlock because that is one of my favorite trees.  In THIS article they used arcOnline to create a spot map of the home range for a species of bird that nests in Eastern hemlock trees.
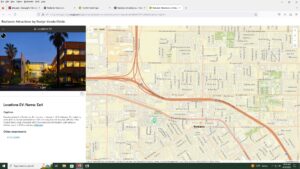
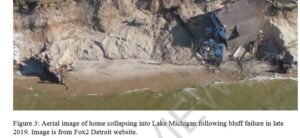
  • For my second article I looked up ArcOnline Michigan coast and found THIS link from a Michigan state grad students thesis project. This article did not include any of the maps that they used to collect their data besides an image from one of their Arial images collect by a satellite about the declining coast of lake Michigan in correlation to human infrastructure.
Delaware data Inventory is already completed.