Kocel, Final

App 1:

For my first app, I created a web map showing academic buildings in Ohio Wesleyan University. This comes from ideas in chapter one. I first went on google sheets and made a list of buildings, a small description of what the building was, and the location in latitude and longitude. Then I downloaded a csv file and uploaded it to ArcGIS online, changed the basemap and the symbol for the buildings, and configured popups. I shaved the map. The next part I wanted to create a web app that is mobile friendly. I clicked creat app, then instant apps. I chose the basic app for this. Then I published the app. 

https://owugis.maps.arcgis.com/apps/instant/basic/index.html?appid=243489a21d4d4971887e181e9891730d


For my second applicaiton, I wanted to create a survey using ArcGIS Survery123 on where students on Ohio Wesleyans campus like to eat. I made it so it can work on phone as wel. 

https://arcg.is/1aO9zv2

Kocel, Week 5

Chapter 7- 3D web scenes

3D maps are important in GIS because we live in a 3D world.  This chapter starts off by first talking about the basics of 3D GIS, then it walks you through the basics of creating web scenes. Tutorial 7.1 was interesting. It showed what the different layers look like on a map.  Tutorial 7.3 was fun, I liked making all the 3D symbols into bushes or trees or flowers. Overall, this chapter was pretty easy to follow and I liked messing around with the different symbols and details on the map. For the application, I think it could be cool to make a 3D map of Ohio Wesleyan’s campus using the 3D buildings and the trees and other symbols provided. 

Kocel, Week 4

Chapter 6 Spatiotemporal data and real-time GIS

This chapter introduces the concept of spatiotemporal data and the values and challenges of the Internet of Things (IoT) in relation to ArcGIS. Spatiotemporal data can be categorized into groups: Moving (live feeds of airplanes, buses cars etc.) Discrete (criminal incident, earthquakes), Stationary (wind speed and direction measurements at weather stations) and CHange(perimeters of wildfires, flooded areas). In spatiotemporal GIS data, the time value of an event can be a point in time or a duration of time. 

Application:

I was really interested in the idea of spatiotemporal data because this chapter was my first time hearing about it. When looking at the Delaware data from GIS 291, I think a good application would be one that is similar to my final from GIS 291, creating a spatiotemporal application that maps emergency incidents. By using available data, the application would display real time emergency incidents as moving or discrete events on a web map. This would include filters by incident type, time of day or severity. It would animate changes over time to identify got spots or trends in emergency services. This application could be deployed as a web app using ArcGIS Enterprise.

Kocel, Week 3

Chapter 3 

This chapter introduces Experience Builder and shows us the basics such as templates, themes, widgets, pages, windows, layouts, ect. It also talks about using Experience Builder to create web experiences. A widget is a JavaScript and HTML component that encapsulates a set of focused functions. Experience Builder provides basic and layout widgets. Tutorial 3:1 is about using Experience Builder to create a web app. It was interesting to learn how to create a simple ‘web experience’. I got a little stuck on tutorial 3:3, I could not find the statistics tab in the dynamic content window,  so I moved on to 3:4.  I was unable to complete 3:4. The beginning of the tutorial had me drag the table widget onto the page and then in the settings pane click ‘new sheet’. However, there was no “new sheet” button in the contents pane so I could not finish it. 

Chapter 4- mobile GIS

This chapter first starts off with an overview of mobile GIS.  There are lots of advantages to mobile GIS but because of the size of mobile devices, CPU speed, memory size, battery power, bandwidth and network are all limited.  The first tutorial is Design a survey for ArcGIS Survey 123. It was just making a survey. It was easy, except in step 13 it said to “click the Incident Type question, and click Set Rule icon”, which was impossible to do because there was no Rule icon where the book said it was going to be nor anywhere else I looked. This did not ruin the rest of the tutorial for me though. The next step was to download an app on my phone for the survey I just created. 4:3 was fine, but there was no “change style” button underneath the layer name that I could see, so I could not do that section. 

Kocel, Week 2

Chapter 1- get started with Web GIS
This chapter introduces the fundamentals of web GIS, outlining its benefits and key components. The basic components of a web GIS app are the base maps, operational layers, and tools. The chapter also emphasizes the power of web GIS to provide real-time data and accessibility across various devices and groups of people. It explains how cloud computing, web services, and APIs facilitate data sharing and integration. The first tutorial was easy once I got going. One of the first things I had to do was make a web map made from data downloaded from the ArcGIS website. Then we had to create an instant web app using a template.

Chapter 2 – smart mapping and storytelling with GIS
This chapter continues discussing feature layers and web apps by first introducing feature layers and the different ways to style them using smart mapping. The tutorials for chapter two were also very straightforward and easy. The first one was just editing names from data imported from Microsoft excel. I got a little stuck on 2:2. When making the style for the map of the top 50 US states, the data for 2020 and 2010 was switched (the directions were to style the Census 2020 data with the theme “above and below” but there was no option for the 2020 data) . 2:3 had some coding, but it was easy to follow.

Kocel, Week 1

My name is Emily Kocel and I am a Junior double majoring in International Studies and Environmental Studies. I am from Worthington, Ohio. I love animals and have always grown up with at least two cats and a dog. I like to draw and watch TV in my free time.

I am a little bit familiar with ArcgGIS Online from taking the previous GEOG 291 course. However it was good to explore and take the time to familiarize myself with the website. I added the basic stuff to my profile like a picture. There are a lot of different courses offered in the Training tab. There are options for individuals or for organizations. I like the community section where people can share their experiences with other people using GIS.

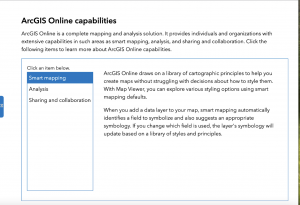
When reading the introduction to what ArcGIS Online is, I found a lot of helpful information. It starts with just a basic overview of what it is, which is a cloud based mapping and analysis solution to make maps, and analyze data, all of which can be shared and collaborated. There are many different things that can be done using ArcOnline such as creating maps, scene apps and notebooks.

The web training ArcGIS online basics was very informative. The beginning talked about different content types, some of which I already knew such as layers. All map and web scenes have layers, each with different data. Together these layers make maps. Scenes are similar to maps except you can visualize from a 3D environment. Apps are new to me, they allow you to control how other users interact with maps and scenes.


I first searched up ArcGIS and deforestation.  ArcGIS Online can be used to analyze deforestation. The Guyana Forestry Commission (GFC) uses ArcGIS Online to monitor deforestation across the nation. They can gather real time information on activities such as mining, wildfires, and agriculture which are all drivers of deforestation.

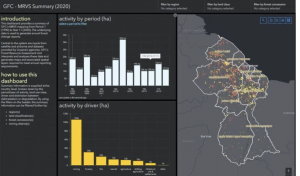
https://www.esri.com/about/newsroom/arcnews/dashboards-help-monitor-and-abate-forest-loss-in-guyana/


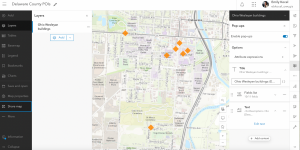
The second thing I looked into was ArcGIS Online and water resource management. It took me to the esri website where there were  different types of water management. One that caught my attention was sewer data management. It said that Sewer Data Management can be used to map separate sewer assets, edit data, view system maps in field and office, view asset reports, and collaborate with map notes. It was developed for state and local governments, airports, ports, and rails, and for facilities. 

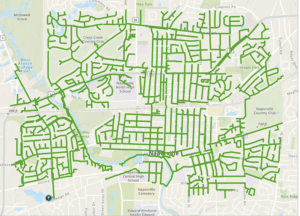
https://doc.arcgis.com/en/arcgis-solutions/latest/reference/introduction-to-sewer-data-management.htm

https://learn.arcgis.com/en/projects/get-started-with-arcgis-utility-network-for-wastewater/