For my first application I created a survey that people living in Delaware can use to file complaints about the schools districts they reside in.
My second application I made a 3D map documenting female Covid-19 cases in Ohio
Geography 292: Geospatial Analysis with Web GIS
Module 2: 3/16/2026 - 4/28/2026, OWU Environment & Sustainability
For my first application I created a survey that people living in Delaware can use to file complaints about the schools districts they reside in.
My second application I made a 3D map documenting female Covid-19 cases in Ohio
In chapter 7 we covered 3D in GIS applications. 3D would be an interesting topic to explore, maps are mostly 2D but we live in a 3 dimensional world, so it would make sense to develop maps in the world we recognize in order to get a better visualization in storytelling, map planning, and architectural design. Learning about the feature layers was so cool, it reminded me of GIS 291 during the final chapters where we could add 3D trees and things to our map to give it more dimension and recognize how the map is visualized, it was really fun being able to relearn some of that.
Application idea: something we could use 3D techniques for in Delaware is viewing population density and how populated town is, where it could be more or less populated in order to build more housing, or protect wildlife and not build where it is unnecessary because of the lack of population in that area.
Spatiotemporal data are data that is collected across both pace and time. It can be collected through observational sensors or simulation models. This can be shown in GIS through live observations that are currently changing and updating. Things like social media, weather events can all be tracked with spatiotemporal data. loT is the network of physical objects that use different data and exchange and collect it. I liked that we were able to connect the different first responders into a web app so they could all coordinate, it really helped me grasp the concept of how GIS uses real time locations and incidents.
Application idea: Something you could use an application for with spatiotemporal data is changing addresses, people are moving in and out of homes in Delaware, we could be able to track how often people move in and out to create a pattern to potentially improve a neighborhood to increase retention in a neighborhood. Using loT we can collect and exchange the data to create a more connected system. We can view how close parks are, the proximity of a nearby city, public parking and proximity to grocery stores and other shops.
I really like learning how to make applications and websites. It is actually really helpful for my classes because it brings in this new idea that I can make a website or GIS application for a class project. It’s really cool that we get to learn how to create a web experience with all these add-ons you would think are really difficult when in reality it’s super easy with just a click of a button. Experience Builder is a really nice website because it gives you an already made layout which you can use, and just add your own information or data to make a web experience. In chapter 4 we learned about mobile ArcGIS and how easy it is to use these complicated sounding apps on your mobile device. These apps were really interesting to learn about because of its use of VR, and its ability to locate things inside and its rapid data collection. In this application we could compare 2D and 3D areas of Delaware, you could compare the Tax districts and zip codes, and see the connections.
It’s nice that the intro for week two was also chill work, it let you explore ArcGIS online and explore different areas than last week, it lets you be independent in what you are learning and learn at your own pace. I like how these instructions are very different from the GIS 291 textbook, they provide a way more in depth explanation to what you need to do, and have really informative pictures explaining the instructions. An idea I have is that you could use this application to place pictures of voter registration sites and how many voters there are, you would use precinct data in Delaware County GIS data hub, and it will locate all the voting precinct areas.
My name is Daniela Flores and I’m from Pennsylvania. I’m a sophomore, environmental science major.
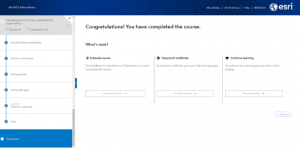
I’m familiar with arcGIS since I took GIS 291 before spring break. I was familiar with the website and found it rewarding that I already knew how easy it was to navigate. It was cool to explore the new website and sort of start over in a way, learning the basics but through a different lens. The online basics training helped me go back into my memory at the start of 291 and really grind the foundational skills into my brain so I could learn them. Meow I really enjoyed the format of the basic training, it was simple information you could learn along with the quiz that helped confirm you learned the topics. I liked learning about things we had used in arcGIS, and learning what they are used for.
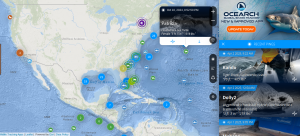
One of my favorite ways GIS mapping is used is shark and sea life tracking. The website OCEARCH is a website that tracks sea life like turtles, seals, sharks and dolphins, with this they are able to see things like migration patterns that we have never seen before. Another GIS application is ASPCA to look at the locations of animals in their shelters, and most at risk to reduce shelter intake, and help the shelters that need it more.