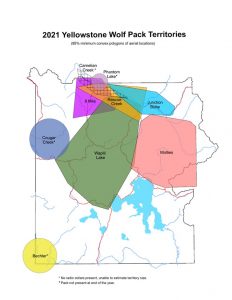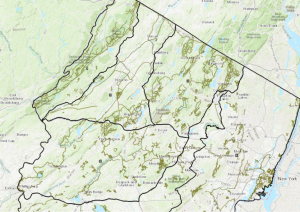
For my app, I made a user-friendly app designed to help people discover every hiking, walking, and biking trail throughout the state of New Jersey. What sets this app apart is that it also displays all designated black bear management zones, offering users important safety information. Inspired by popular platforms like AllTrails, NJ Trails provides a comprehensive map of trails without requiring users to report or upload trail data themselves. Instead, it draws verified information directly from the New Jersey Parks Department and the state’s Environmental Protection Agency. One of the app’s goals is to encourage more people to explore lesser-known parts of the state, like the more remote areas of Warren County, by providing accurate, real-time data and reducing fears about bear encounters. NJ Trails also includes a live tracking feature that allows users to monitor their distance traveled, elevation gain, and other key stats during their outdoor adventures.
App 2: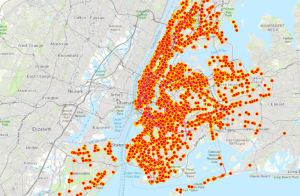
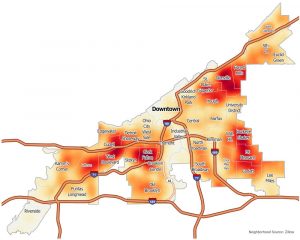
This app is designed to show where open job applications are in distance from the subway stations and lines in New York city. This will help people who work in the food industry and are trying to find a job or possibly look for a different job and want to know about their commute in the city. New York City is one of the most densely populated cities in the country with over 23,000 restaurants in the city and over 250,000 thousand residents that work in the city. There are constantly new ones popping up every day and restaurants closing every week. It is almost impossible for a simple line cook to figure out where to work next without putting hours of their own research into finding a new place of work. This application takes that stress and hours of work away and simply shows you when a new place is open to work with the simple click of a button. People are able to look at an opening and place their home on the map and see how long the commute would be. Restaurants would just have to post their job opening on the map and people who have the app will be able to get the alert that there is a new opening and see if it is a good fit for them to work there. This will help the businesses find workers faster and help residents who are in the job market find a place faster. The app will be called food 4 hire NYC.
(I could not figure out how to share it with the class so here are screenshots of them and they are public on Arc online)