Hess – Week 3

Chapter 3:

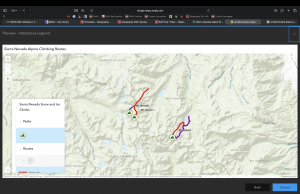
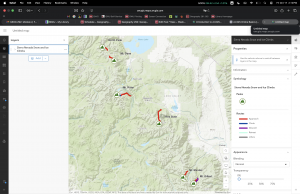
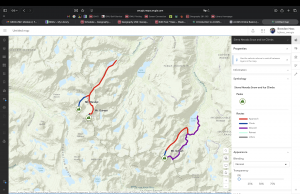
This chapter focusses on how to create web apps to make maps interactive and easy for people to use. One thing that interest me a lot was how land usage over time changes and this can be shown through GIS. Widgets can be added to your web apps to make it wiser to use features like search bars, sliders, and charts. Another important part of the chapter was learning how chart widgets can make data more practical by chowing graphs instead of just points on a map. This is helpful when it’s provided for the more general public and you want them to understand. I think these tools make apps much easier to use for the greater, but also for the general public to be able to use. it helps scientists to communicate their research and findings to the general public.

An application idea could be to show the hurricanes in Florida throughout a range of years and all the damage that they have done, to the land and the buildings.

Chapter 4:

This chapter mostly focused on mobile GIS and why it is useful. Mobile GIS lets people to collect, record, and use data in the field, instead of retiring to a desktop computer to use the data. Mobile GIS is great for tracking data that computers are not able to be taken, these mobile devices also have a GPS, so tracking data is fast, accurate, and efficient. The chapter also explained some challenges of battery life and having weak cell service. Volunteer Geographic Information (VIS) is another thing that the chapter covered, this is information reported by people, like road issues or wildlife sitings. Augmented Reality (AR) was anything interesting topic that the chapter talked about, this allows you to bring something to life in the real world through your phone or devices camera. I also learned that the feature layers are easily editable so people can add new information, update information, or delete information very easily if needed.

An application idea for this would be to make a web app where people can edit a feature layer to allow for animal sitings and report them with a more accurate location than the current way.

Hess – Week 2

Chapter 1:

I learned that you can import a new feature layer into ArcGIS Online instead of creating one from scratch. In your map you have options to add tables and layer, change the base map used, and create charts and legends that go along with your map. You can also use the ArcGIS database to search for other layers as well as searching from an atlas. Within this function, you can have the option of making them transparent, as well as changing the style of and symbols of the map. These maps you can then share with others within your organization, or publish to the Map so that anyone can access it publicly. You can create story maps (kind of like slide shows) that can include images, videos, and other media throughout your map.

Chapter 2:

ArcGIS Online has a very large selection of templates available, each are for different data, such as collecting and categorizing data of for things such as 3D scenes. Each WebGIS app is formed from 3 components, the baseman, the operational layers and th additional tools for that project. A living Atlas is an ESRI hosted collection of maps, apps and databases available to add in and use with your own applications and maps. Arcade allows you to use expressions to manipulate the data that you already have collected instead of needing to change the underlying data.

One potential application that this could be used with is to map all of the roads in the area and also map all of the major businesses in the area, this could give you a good idea of if the road ways are in the most effective layout.

Hess – Week 1

Hello, my name is Brendon Hess and I am a Sophomore majoring in Biology and Environmental Science. I am from Perrysville Ohio and I am on the Men’s Soccer team here.

I looked more closely into some of the basic functions and features of my account and I thought it was a very cool layout. I looked through the ERIS Community page a little bit and found that very interesting, its nice that there is one platform for everyone using this site to communicate through and collaborate with each other on ideas, topics, and projects.

Then I read the “Get started: What is ArcGIS Online“, this was a very informative read. I think that it is cool that this Online version can be used for field work, I never thought about that when I was taking Geog 291. I also find it very cool that you can collect your own data and input it into your own system.

After that I went on to complete the ArcGIS Online Basics course, I got to lean about the different layers and how you can interact with them. I also learned how to keep your work within your administration, group and private as well as public. Here are some of my screenshots from the course as well as the certificate.

I already used google scholar to look into GIS Applications in GEOG 291.